Looking for Safe Harbor: What Happened to Pier 1?
- Pier 1 is shuttering up to 450 locations and laying off workers after 8 quarters of sales declines
- Pier 1 shoppers have been turning to Wayfair and HomeGoods among other specialty Home Furnishings retailers for the last two years
The latest victim of the retail apocalypse, Pier 1 announced plans to close up to 450 of its 942 stores on January 6. The company is taking bold steps toward reducing costs, but it remains to be seen whether the troubled Home Furnishings retailer will be able to return to sales growth.
What has led Pier 1 to this point? Earnest dug into the spending behavior of millions of de-identified U.S. consumers to find answers.
Online and Discount Retailers Gobble Share
The Home Furnishings market has changed a lot in just the last two years. Juggernaut Bed Bath & Beyond lost the most share among Home Furnishings specialty retailers over the last two years (-8% market share by sales), while Wayfair gained the most share (+8%). Pier 1 lost 1% share over the same time period. At Home, Crate & Barrel, and HomeGoods also made gains since 2018 (all +1%), taking share from Pottery Barn, Restoration Hardware, and Williams-Sonoma (all -1%).
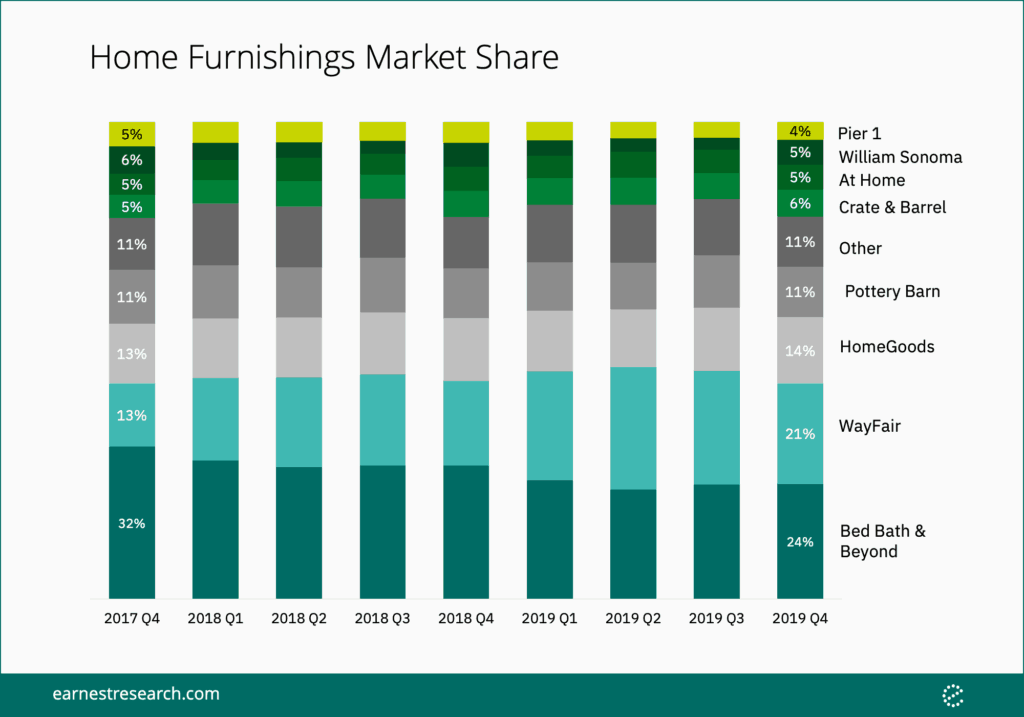
Numbers cited may not add to 100% due to rounding.
Other merchants include Bob’s Discount Furniture, Restoration Hardware, and West Elm.
Among Peers, Not #1
Spend among Pier 1 shoppers* also shifted during the past two years. Pier 1 lost 1% of market share across all Home Furnishing specialty retailer spend, but lost 3% of share among its own customers’ Home Furnishing wallet. Wayfair gained the most share of wallet (+6%) among Pier 1 shoppers’ Home Furnishing spend. Similar to the Home Furnishings market at large, At Home, Crate & Barrel, and HomeGoods made a notable share of wallet gains since 2018 (all +1%). Pier 1 customers still spent the majority of their Home Furnishing dollars at Bed Bath & Beyond in 4Q19 (21%) with Wayfair supplanting Pier 1 as the second place retailer since 4Q17.
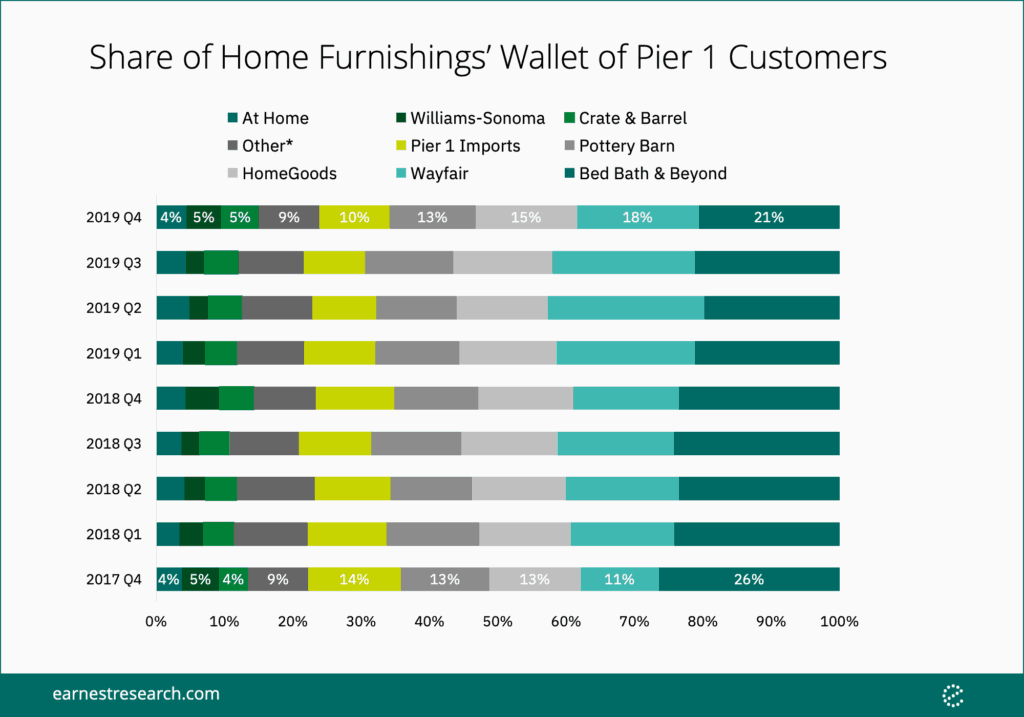
Other merchants include Bob’s Discount Furniture, Restoration Hardware, and West Elm.
Going the Way of Wayfair
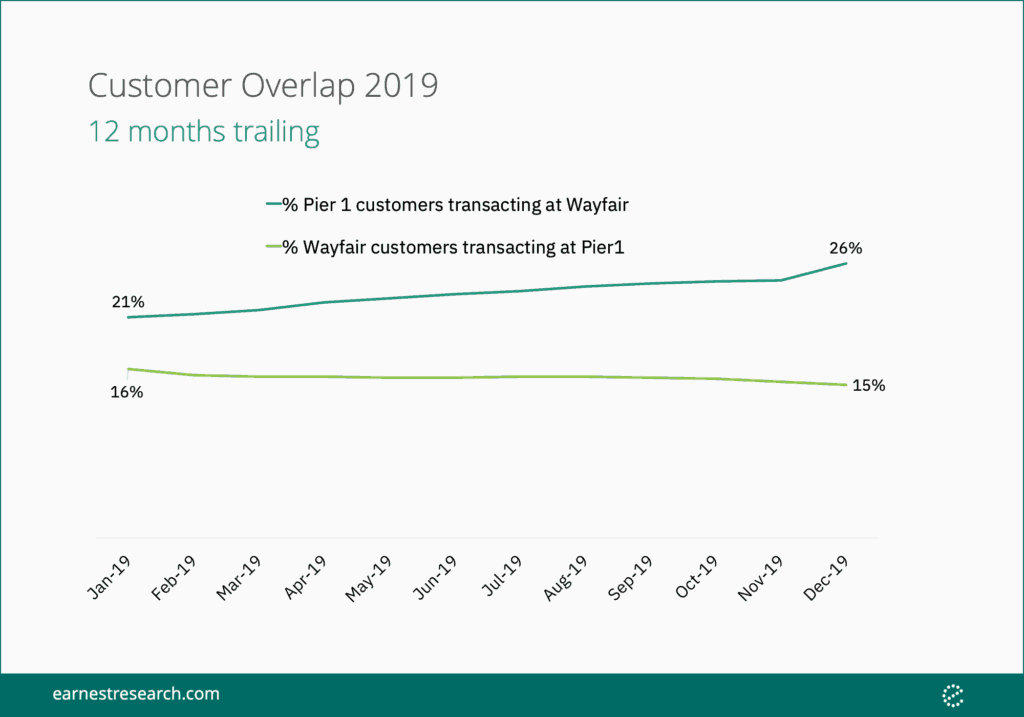
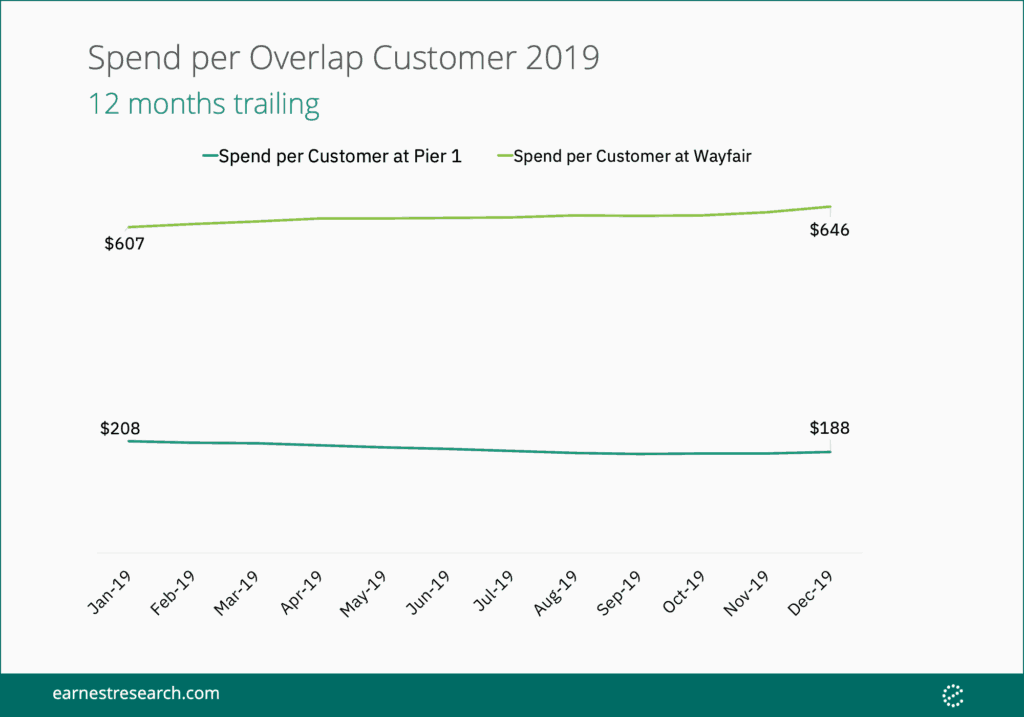
Earnest data suggests that Wayfair had a notable impact on Pier 1 sales. Between January and December 2019, the proportion of Pier 1 shoppers transacting at Wayfair rose to 26% (+5% YoY), in line with overall Wayfair shopper acquisition. Customers who shopped at both Wayfair and Pier 1 spent $188 (-11% YoY) at Pier 1 while increasing their spend at Wayfair to $646 (+6% YoY). There is a bright spot for Pier 1 in this trend: the customers who shop at both companies are not Pier 1’s biggest spenders. Shared customers spent 56% less at Pier 1 than Pier 1’s average customer in 2019.
Pier 1 customers are increasingly turning to discount and online-only Home Furnishing brands for their spiced candles and glittering centerpieces. We will continue to track if Pier 1’s right-sizing efforts and online push (currently estimated around a quarter of total sales) can revive their sales slump and bring shoppers’ dollars back to Pier 1’s shores.
Notes
*Share of Wallet analysis includes all consumers who made a purchase at Pier 1 between 2017 and 2019.
This analysis was created utilizing transaction data products and solutions offered by the Earnest Consumer Brands team. For more information on our Consumer Brands products, click here.
