Holidays in Review: The Omnichannel Experience

Sales continue to shift from bricks to clicks and most of those clicks happen during the most wonderful time of the year. We analyzed the spend of millions of anonymous U.S. consumers during the 2018 holiday season (from mid-November through the first week of January), to better understand the drivers of the shift to online sales.
A Year of Online Growth
Big box retailers like Walmart, Target and Best Buy are betting on successful online strategies to better compete with Amazon. While online sales still represent a small piece of total sales for these traditionally brick and mortar retailers at 10%, their total online sales grew 33% YoY this past holiday season.

An encouraging trend for these retailers is that the increase seems to be driven by the frequency of shopping, rather than basket size. On a per customer basis, we saw 3.1 online holiday transactions per shopper at big box retailers, an increase of over 15% between 2017 and 2018.
This makes sense as faster shipping times, lower shipping fees and cross-platform purchasing allow customers to do all of their shopping from the comfort of their home or with the convenience of a few taps on their phones.

Amazon’s Gift to Customers: A Seamless Checkout
Amazon continues to invest in the online shopping experience of its customers. From various shipping fee strategies to Prime membership and third-party seller growth, among others, customers appear to be checking-out more frequently. The number of transactions per shopper in 2017 increased by 10% to 12 transactions over the 8-week holiday period. In 2018, the frequency of online shopping further increased to 13.2 transactions per customer, or in other words, almost two online orders each week.
These increases in frequency are a clear indicator of just how seamless online shopping has become – helping nudge customers to the checkout.

Ordering In Over the Holidays
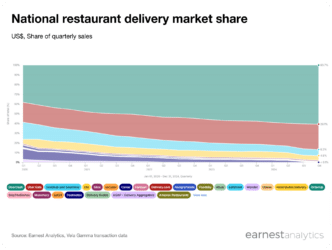
The ongoing consumer shift to online is equally important for third-party delivery services. We looked at holiday spend across sixteen major food delivery companies and found a similar trend to the retailers*. People are not necessarily spending more money each time they order food, but they are ordering in more frequently. The 2018 holiday period saw 5.3 orders per customer, (up ~ 7% from 2017) with an average ticket of $30 (down ~ 7% from 2017).


