Full Review: 2019 Holiday
We reviewed our data for the full 2019 holiday period* to investigate the main trends and takeaways this holiday season.
Key Takeaways
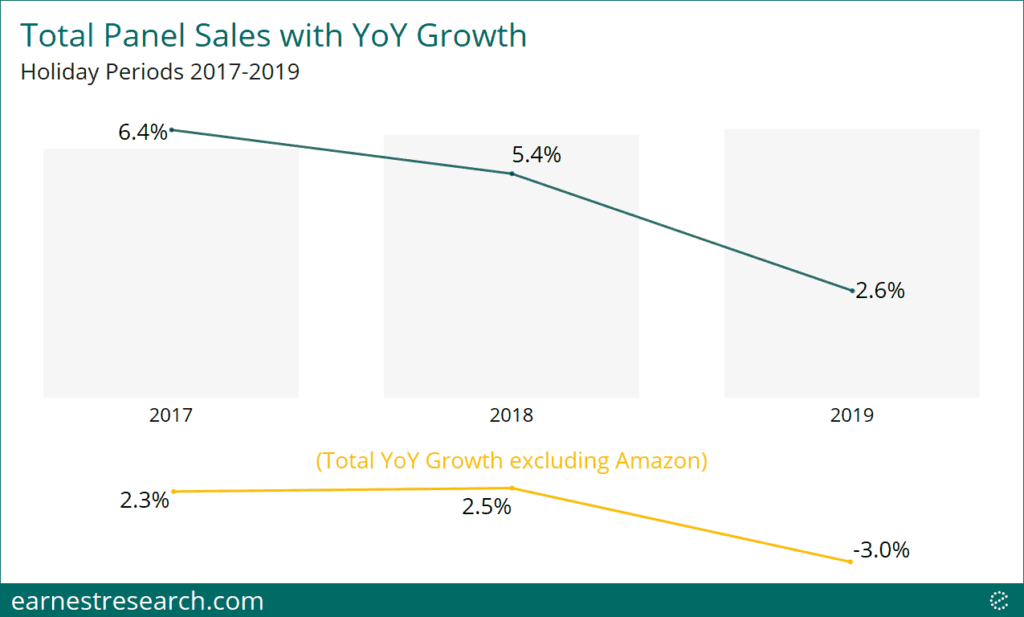
- Overall performance appeared soft, growing 2.6% YoY this holiday season, a notable 280bp slowdown from last year’s 5.4% YoY performance.
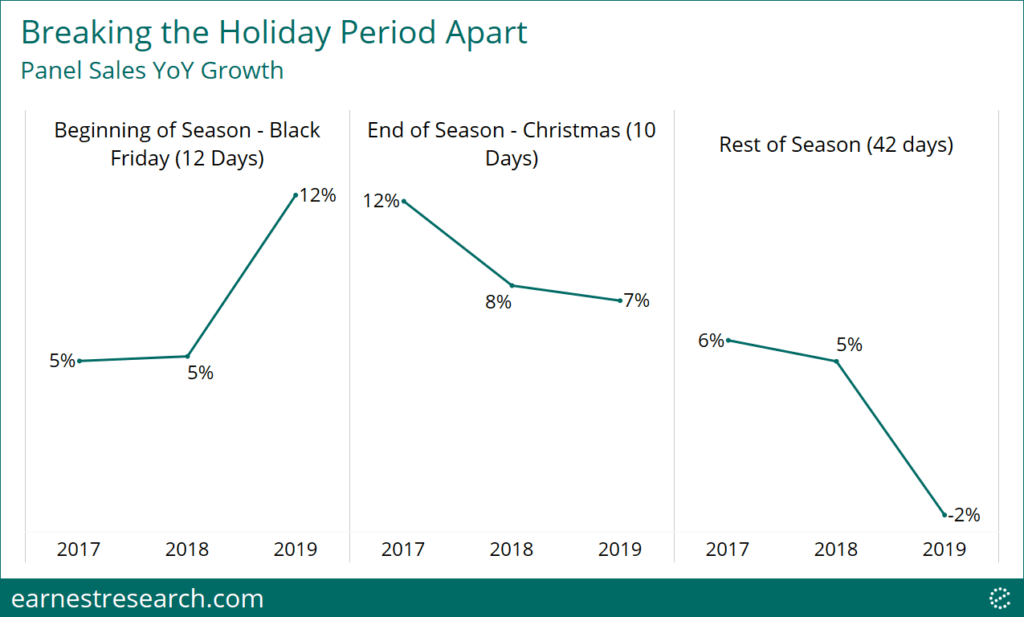
- While this year’s Black Friday period produced an early 7 point acceleration, with 6 fewer days between Thanksgiving and Christmas, the rest of the period normalized down as the season progressed.
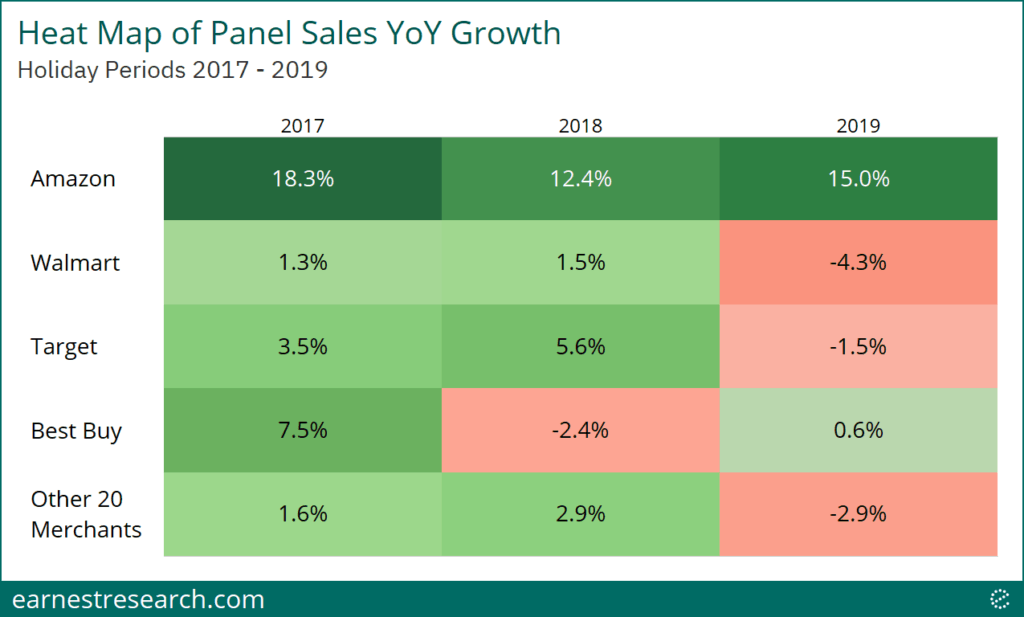
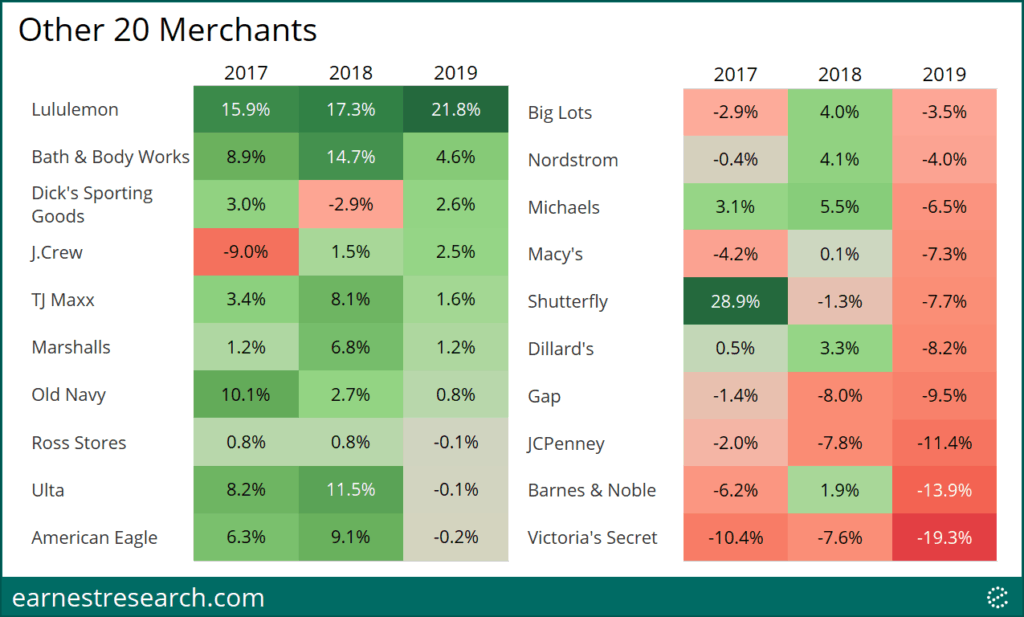
- Amazon and Best Buy saw their YoY growth accelerate, while Walmart, Target, and the majority of other retailers saw theirs slow. Lululemon and Dick’s stood out from their peers with accelerated growth, while JCPenney, Barnes & Noble, and Victoria’s Secret saw double-digit YoY declines.
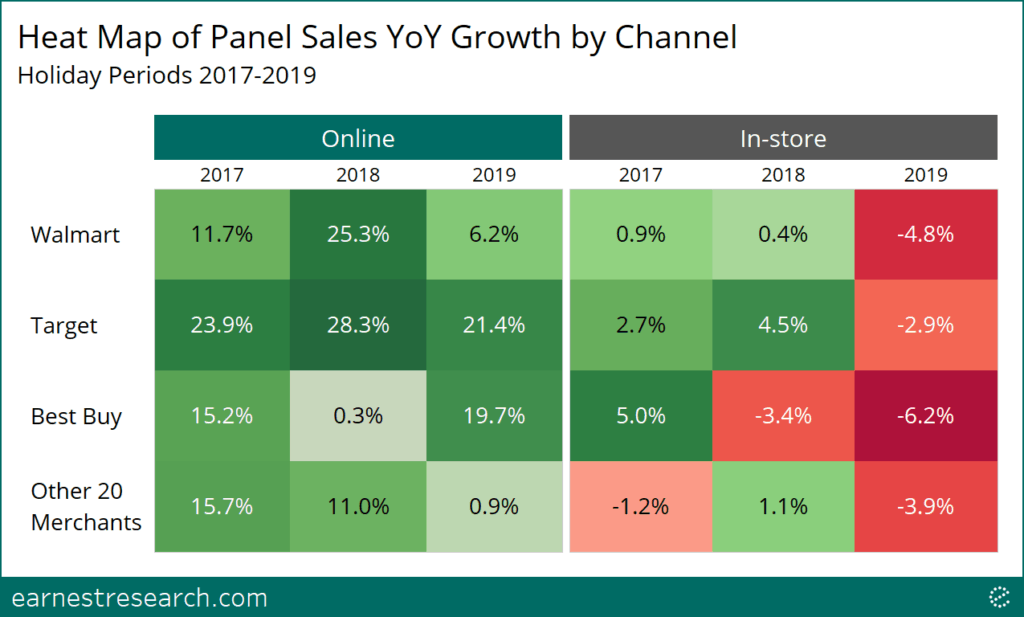
- Online sales at retailers excluding Amazon represented 12% of total spending and helped lift total growth 1 point. Target and Best Buy saw solid online growth, while Walmart and most other retailers saw both their online and in-store channels slow with few exceptions.
Overall Performance
Spending as a whole appeared soft, growing 2.6% YoY this holiday season, a notable 280bp slowdown from last year’s 5.4% YoY performance. Amazon continued to be integral to performance; the industry excluding Amazon slowed 550bps, or twice as slow, to a 3% YoY decline.
A Three-Part Holiday
In order to understand the effect of a compressed 2019 holiday season, we divided the season into three distinct periods**. The Black Friday period produced an early 7 point acceleration, however, with 6 fewer days between Thanksgiving and Christmas, the rest of the period normalized down as the season progressed. Interestingly, the 10 days surrounding Christmas saw a 1 point slowdown from last year’s 8% YoY growth.
A Small Bag of Accelerated Growth
Amazon and Best Buy saw their YoY growth accelerate several percentage points, while Walmart, Target, and the other 20 merchants in aggregate saw theirs slow. Lululemon, Dick’s, and J.Crew stood out from their peers with accelerated growth, while the majority of other merchants showed soft performance, notably JCPenney, Barnes & Noble, and Victoria’s Secret.
The 1% Online Lift
Looking at performance by channel (and excluding Amazon), online sales represented 12% of total spending. And while online growth continued to slow, its performance helped lift overall growth about a point, raising in-store YoY decline of 4% to a total YoY decline of 3% (as depicted in the first chart above).

Soft Across with Few Exceptions
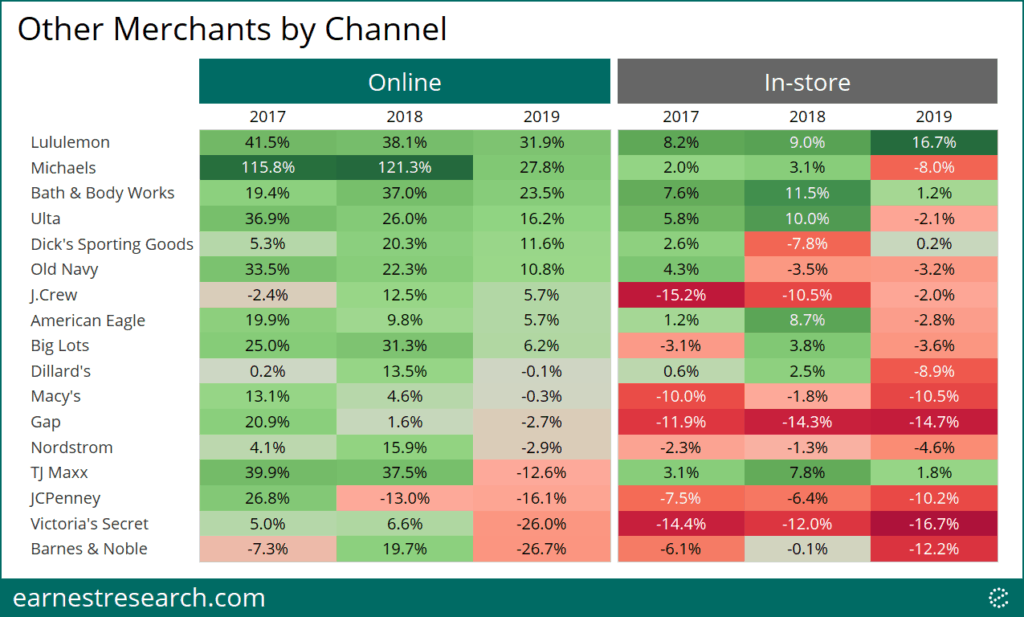
Looking at individual merchants, online growth was solid at Target and Best Buy but slowed ~10 points at Walmart and the rest of the industry as a whole. Virtually all merchants saw both their online and in-store channels slow with few exceptions. Best Buy saw diverging trends between channels while Lululemon, Dick’s, and J.Crew stood out with solid performance across channels.
Notes
Analysis excludes spend made on store-branded cards that will likely not be paid down until after the Holiday period. Many retailers in this analysis are highly sensitive to this exclusion.
*We define the full holiday season as 64 days from the first Friday in November to the first Friday in January.
**The beginning of the season is defined as 12 days from Thanksgiving to the following second Monday. The end of the season is defined as 10 days from the Wednesday prior to Christmas to the last Friday in December. The rest of the period is defined as the remaining noncontinuous 42 days, including a) the first Friday in November to Thanksgiving Day, b) the second Tuesday following Thanksgiving to the Wednesday preceding Christmas, and c) the last Saturday in December to the first Friday in January.
Analysis excludes the retailer Kohl’s due to certain structural biases in Earnest data. In general, all merchant performance trends should be interpreted in the context of our EarnestKPI differentials. For a better understanding of our biases and differentials, schedule a demo.
