Academy Sports’ COVID-driven IPO
In anticipation of Academy Sports & Outdoors’ upcoming IPO, we analyzed the retailer’s market share, channel performance, the impact of its geographic profile, and shopper cohorts including recipients of the federally granted stimulus check. Additionally, we looked at sporting goods’ wallet share among Academy’s most vs. least loyal customers. Here’s what we found.
Key Takeaways
- Market share for Academy grew significantly in 1H20 with online share accelerating and its in-store share now rivaling Dick’s.
- Academy’s geographic exposure was well suited to benefit from fewer Covid restrictions and early lockdown expirations in Texas and across the south.
- Increased sales per shopper, rather than the number of shoppers, was the main driver of growth, in-line with Covid-related consumer behavior.
- Stimulus recipients drastically outspent non-recipients, to a peak delta of ~30 pts.
- Loyal customers from 2017 saw wallet share increase from 70% in 2018-2019 to peak at 78%, while their least loyal shoppers moved from ~40% in 2018-2019 to spike at 60% share, although both have normalized down in recent months.
COVID Market Share
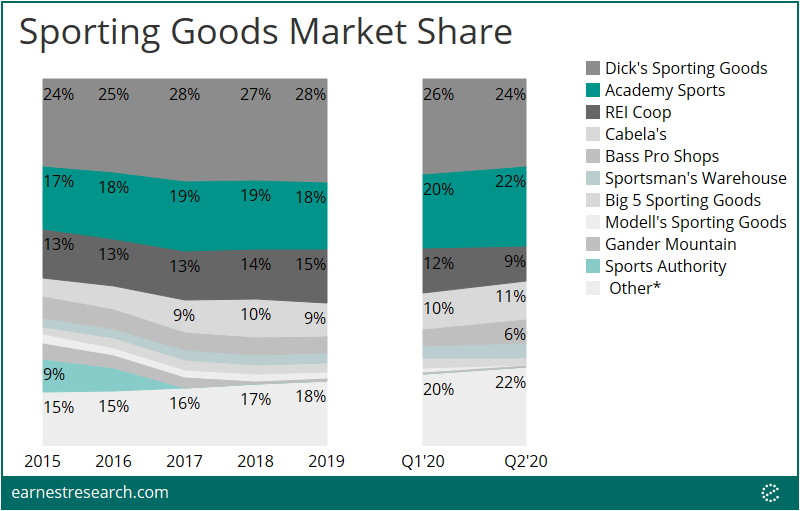
Among Sporting Goods retailers, Academy ranks second behind leader Dick’s, followed by outdoor oriented retailers REI, Cabela’s, and Bass Pro and well ahead of other sports focused stores such as Sportsman’s Warehouse, Big 5, and Modell’s. Importantly, Covid’s disruption in the first half of 2020 saw a material shakeup to Academy’s benefit; with the retailer increasing its market share ~2 to 4 points, largely at the expense of Dick’s and REI.
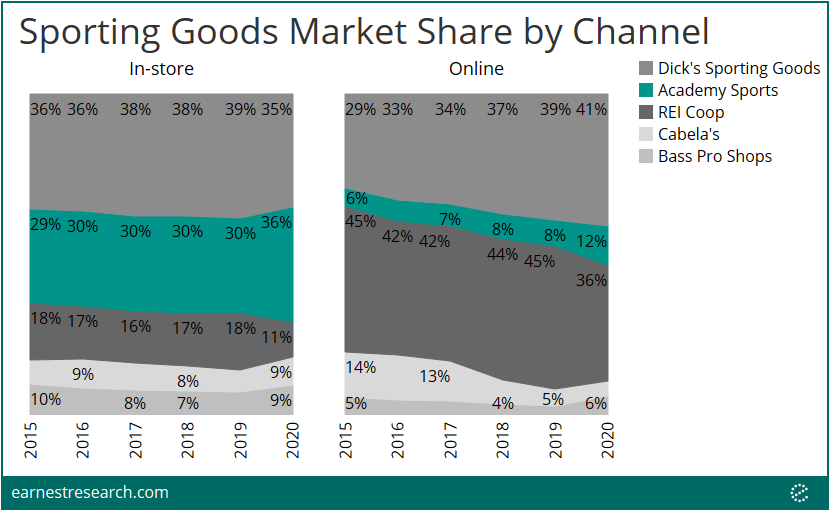
Cutting market share by channel among the top five retailers highlights this 1H20 benefit more clearly. Up until this past year, Dick’s was growing its in-store and online share several percentage points, while Academy was only inching up its share online. This last six months saw the reverse: Academy grew its in-store share surpassing Dick’s ~35%, and also managed to double its online share from 2015 levels, albeit from a relatively small base.
Geo Footprint
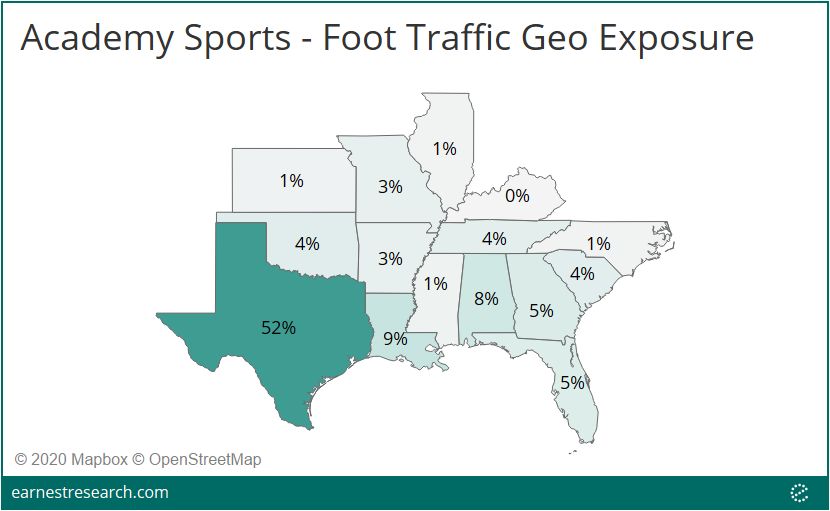
Academy’s store footprint may have something to do with its recent success. Using foot traffic data, we saw over half of Academy’s foot traffic occurring in Texas, followed by Louisiana (9%), Alabama (8%), Florida (5%), and Georgia (5%). As noted in our Reopening to Resurgence analysis, these states saw earlier stay-at-home order expiration dates and thus consumer activity was not as starkly impacted relative to the rest of the country.
Fewer Shoppers, More Dollars
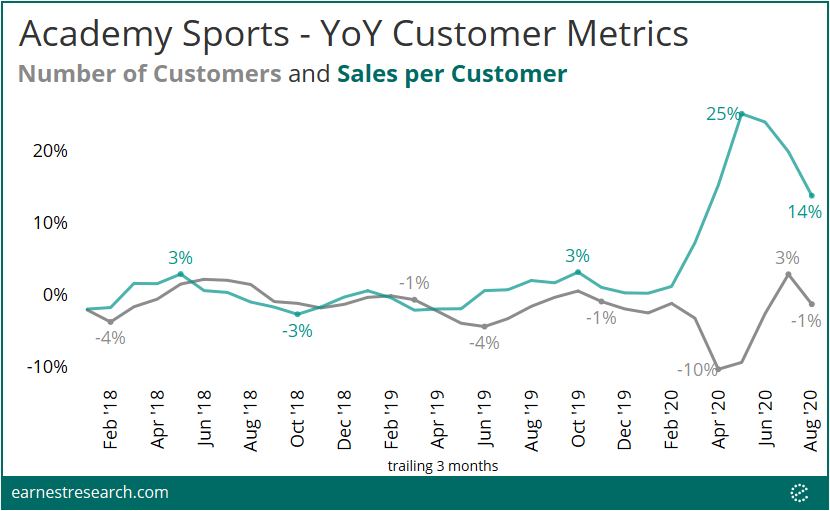
In-line with Covid-behavior, Academy’s performance this past quarter was driven by ticket size per customer vs. the actual number of customers. While the number of customers declined ~10% during the pandemic’s lockdown, this was more than offset by a ~25% growth in sales per customer over the same period. This dynamic has stayed the course: August (trailing 3 months) shows a strong 14% growth in sales per customer amidst a 1% decline in the number of customers.
Stimulus Recipients Stimulate Growth
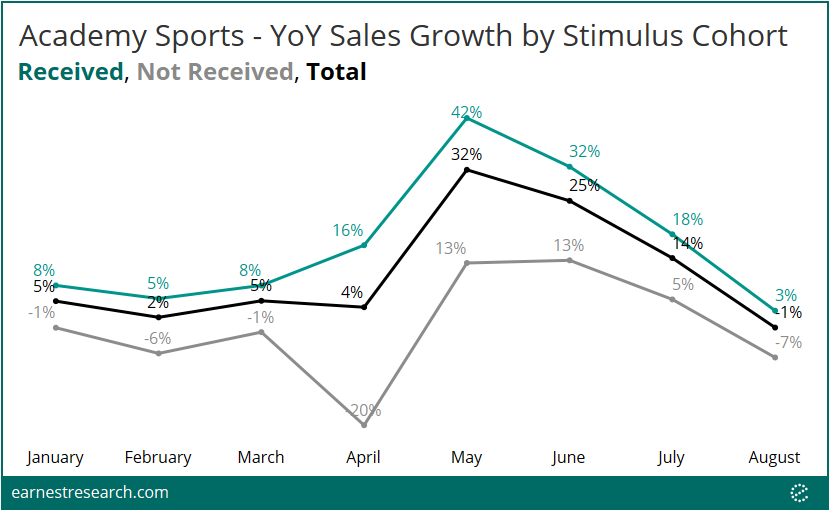
As we’ve seen across several other retailers, Academy benefited from stimulus recipients over the past several months. The cohort that received the stimulus outspent those that didn’t with the delta peaking at ~30% during the crisis trough. Interestingly, the past month has seen a narrowing of this outperformance to more normal growth levels and a 10 point delta.
Least Loyal Shoppers Increasingly Spending at Academy
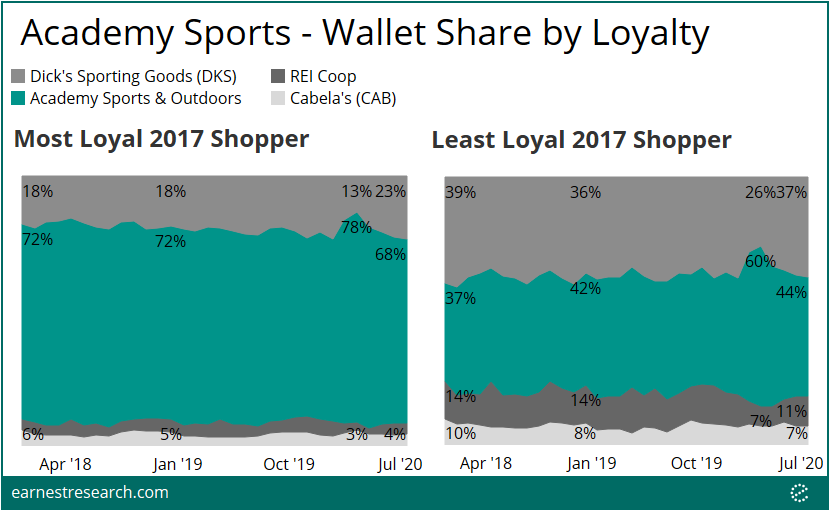
Comparing Academy’s most vs. least loyal shoppers in 2017, we looked at how loyalty manifested in different wallet share distributions among the major sporting goods retailers these past few years.
Not surprisingly, the most loyal 2017 Academy shopper spent over 70% of their sporting goods wallet at Academy in 2018-2019, increasing to 78% during the crisis. However, this has since normalized to 68% with notably more dollars going to competitor Dick’s in recent months. On the other hand, Academy’s least loyal 2017 shopper spent ~40% of their wallet at Academy in 2018-2019, rising substantially to 60% during the crisis. Again, over the past few months this has also normalized down to 44%—still higher than the share it began with in 2018—and notably higher than at Dick’s.
Notes
*Other includes (each with ~2% share or less): 2nd Swing, Baseball Monkey, Brownells, BSN Sports, Buds Gun Shop, Callaway Golf, Carl’s Golfland, City Gear, Club Champion, Competitive Cyclist, Dick’s Sporting Goods Warehouse, Dunham’s Sporting Goods, Edwin Watts Golf Shops, Field & Stream, Gander Outdoors, Golf Galaxy, Golf Warehouse, Hibbett Sports, JustBats.com, Lucky Gunner, MidwayUSA, Moosejaw, Mystery Tackle Box, Olympia Sports, Optics Planet, OVERTIME by Dick’s Sporting Goods, Pedego Electric Bikes, PGA Tour Superstore, Play It Again Sports, Rad Power Bike, Razor, Rip Curl, Ron Jon Surf Shop, Scheels, SidelineSwap, Soccer.com, SquadLocker, SurplusAmmo, Tackle Warehouse, Tennis Warehouse, The Sportsman’s Guide, West Marine.
**Most loyal is defined as the top 20% of spenders and least loyal as the bottom 20% of spenders at Academy in 2017
