Inflation shakes up cereal market share
Inflation grew at a historical 7.9% in February 2022, as manufacturers passed along higher input costs as a result of higher demand and the conflict in Ukraine. However, not all brands increased prices at the same rate, leading to sudden market share changes across CPG and other retail categories, including cereal.
Key takeaways:
- General Mills ($GIS) topped major hot and cold cereal brands in price increases in March
- Market share by sales shifted towards brands with higher price increases…
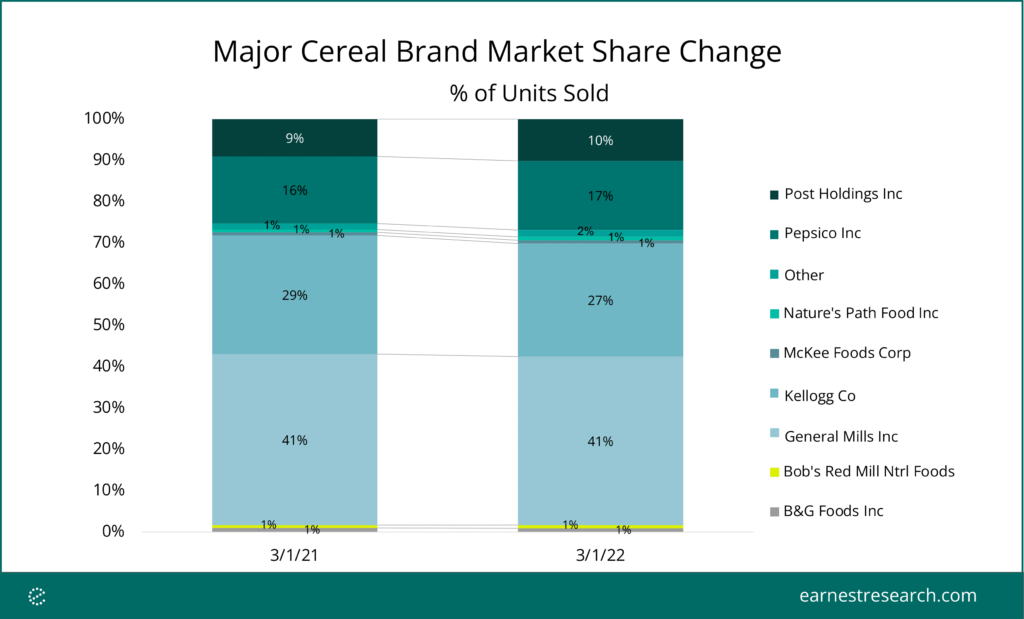
- …but share of total units sold favored brands with mid to lower price increases
General Mills, PepsiCo ($PEP), Kellogg ($K) prices grew the fastest
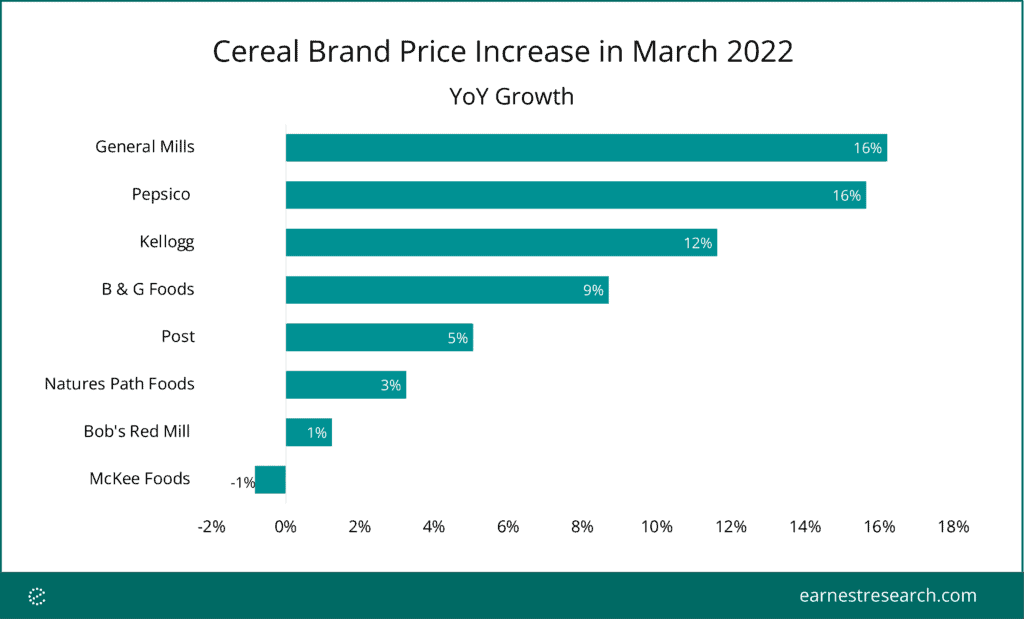
Looking at YoY price trends across key parent manufacturers in the space shows that over the recent period General Mills (maker of Cheerios), PepsiCo (maker of Quaker Oats), and Kellogg (maker of Special K) passed along the highest YoY price increases, whereas B & G Foods (maker of Cream of Wheat), Post (maker of Honey Bunches), Nature’s Path, and Bob’s Red Mill have seen more modest price appreciation. This includes the price paid per unit across all units sold by that brand and does not include other forms of inflation such as shrinkflation or substitution.
General Mills price increases drive market share gains…
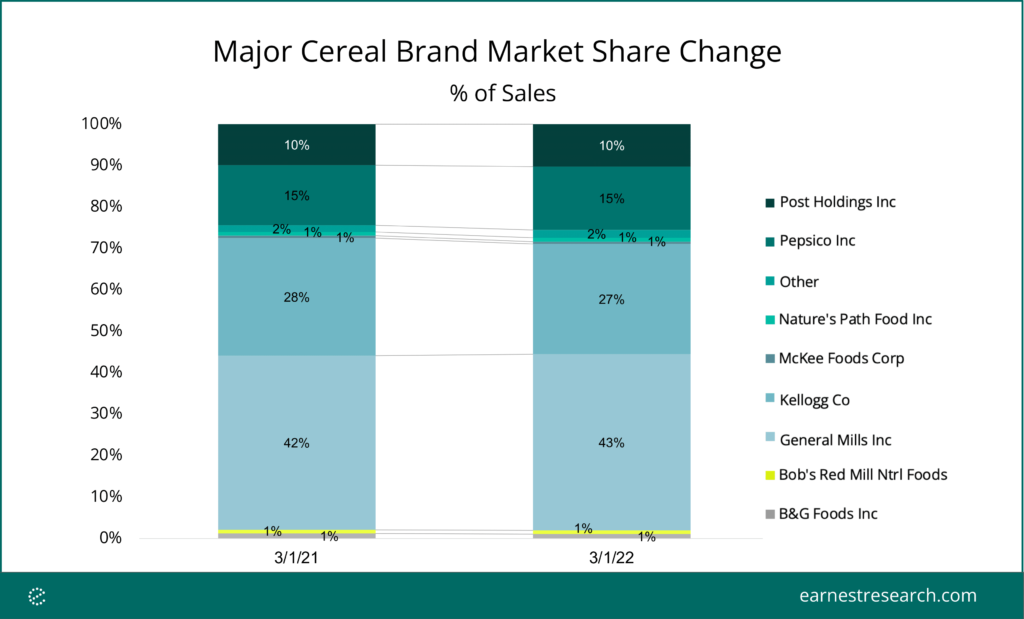
Despite rising prices among most major cereal brands, only the fastest grower, General Mills, also grew its market share by sales in the US. Runner-up in price increases, Pepsico, maintained its market share, while Kellogg lost share to General Mills.
…while units moved told a different story
Adjusting for inflationary pressure by focusing on units sold reveals a more nuanced market share view. Post and Pepsico’s share of boxes sold grew YoY, with share largely coming from Kellogg. In terms of units, General Mills share was flat YoY in March, suggesting its market share gains came entirely from higher pricing. In effect, bigger price increases did not uniformly lead to share increases, suggesting customers could have shifted brands as a result of higher prices.
There are many more ways to slice the impact of inflation than price growth and market share. We will continue to track the impact of pricing pressure on CPG and other categories using Earnest Analytics (FKA Earnest Research) Scanner data.
Notes
- Analysis presented includes the top 15 manufacturers by total US dollar volume in the Earnest Analytics (FKA Earnest Research) Scanner data “CEREAL” category. Excludes cereal bars and adjacent products: Mars (Kind bars) ; Cliff ; Simply Good Foods (Quest) ; Ferrara Candy ; The Hershey Company ; Baker Mill (Kodiak Cakes).
- “Other” includes a constant basket of 35 additional manufacturers tagged in the data: Frankford Candy Llc, Iovate Health Sciences Usa Inc, Goya Foods Inc, Kraft Heinz Co, General Nutr Centers, Hero Group, Beyond Better Foods Llc, Dole International Holdings Inc, The Manischewitz Co, Conagra Brands, Mccormick & Co Inc, Brooklyn Bottling Group, Alanric Food Distributors Inc, Unilever, Nestle S.A. (Switzerland), Brynwood Partners, Starbucks Coffee Co, Sun Maid Growers, Flowers Foods Llc, Abbott Laboratories Inc, Campbell Soup Co, The Hain Celestial Group Inc, Hornell Brewing Co, Del Monte Foods Inc, Kohlberg Kravis Roberts, Melissas/World Variety Produce Inc, Food For Life Baking Co Inc, Amplify Snack Brands, Grupo Bimbo, Pinnacle Foods Group Llc, Kohlberg & Company, Continental Mills Inc, The J M Smucker Co, Hormel Foods Llc, Glanbia Plc, Mondelez International Inc
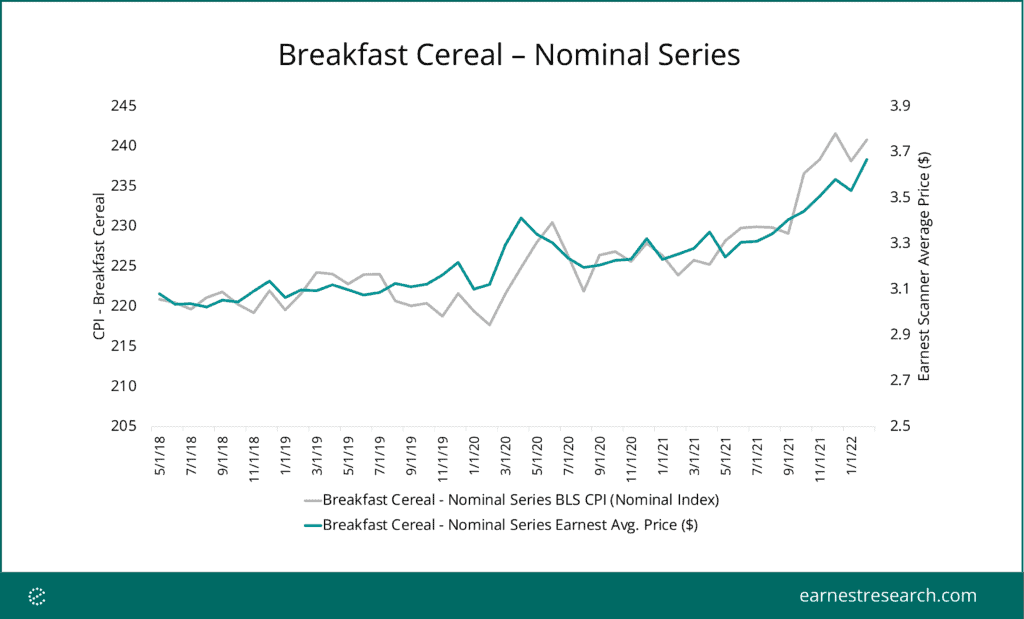
Earnest Analytics (FKA Earnest Research) Scanner data tracks the Breakfast Cereal CPI Index with a 0.89 correlation (including all Cereal brands, not only the top 15).
