Consumer wallets shift from Online, Home to Gas
Key takeaways:
- Consumers still spend the bulk of their dollars at Big Box stores despite shifting wallets
- Rising fuel prices are taking dollars from other categories, especially Online Marketplaces and Home
- The consumer wallet is structurally different from pre-pandemic after sustained increases in Delivery Aggregators and Online Marketplaces spending
Consumers spend the most at Big Box Retailers
Earnest Analytics (FKA Earnest Research) transaction data captures consumer credit and debit card activity across thousands of companies and dozens of categories. As a result the data paints a picture of total consumer spending on most goods and services. See methodology note at the end for wallet share calculation explanation.*
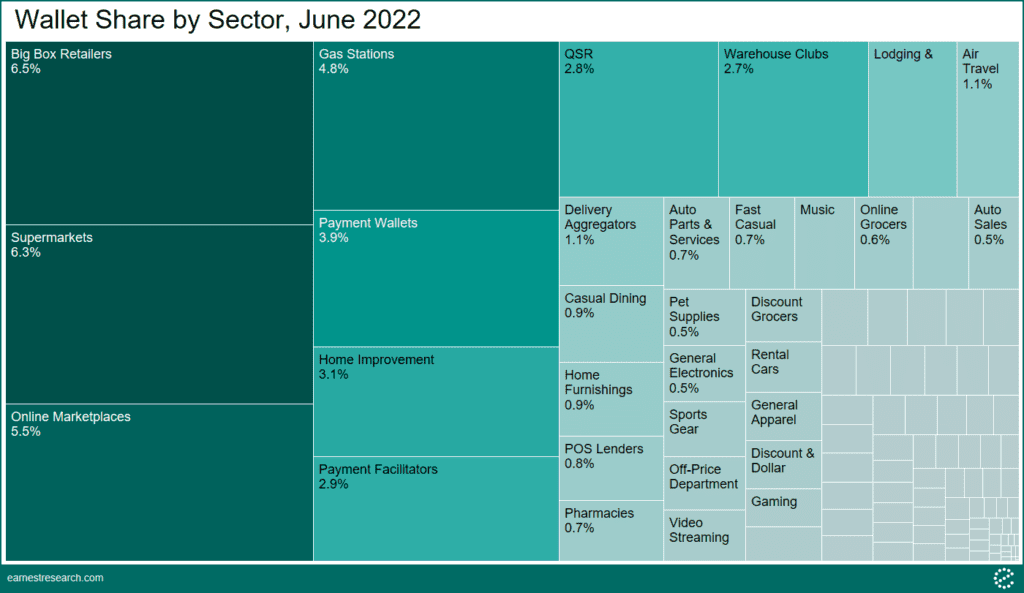
Consumers spent over 6% of their total monthly wallet at Big Box retailers such as Walmart and Target in June 2022, followed by Supermarkets (Kroger, HEB, Publix, etc.), Online Marketplaces (Amazon, eBay, etc), and Gas Stations. Home Improvement, QSR (fast food), Warehouse Clubs, Lodging & Accommodations, and Air Travel rounded out the largest remaining categories.
Spending moved from Online Marketplaces and Home to Gas Stations YoY…
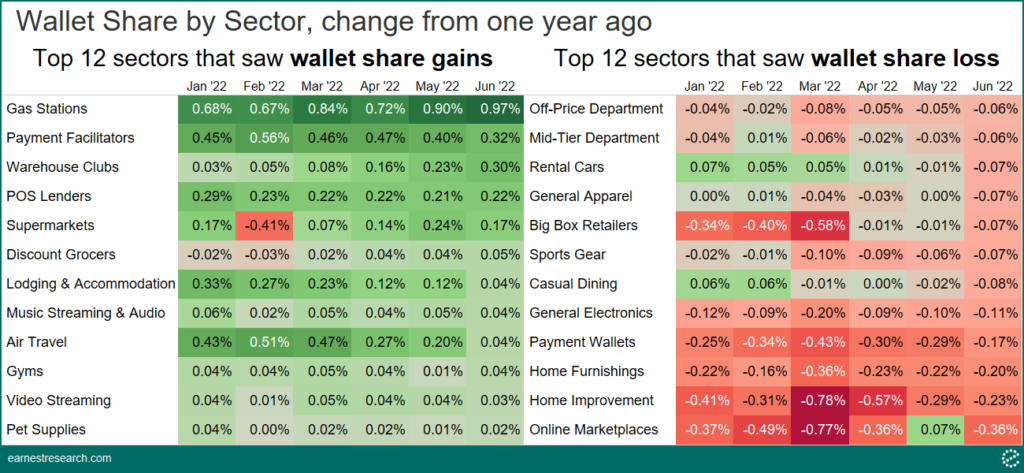
Gas Stations’ share of consumer wallet grew 68 bps from January 2021 to January 2022, accelerating to 97 bps in June 2022. This increase primarily came at the expense of Online Marketplaces (-36bps in June), Home Improvement (-23bps), and Home Furnishing (-20bps). Similarly, many discretionary categories such as Department Stores, Apparel, Sports Gear, and Electronics receded 6 to 11 bps YoY. Big Box Retailers, which comprise the bulk of total consumer spending, also lost share each month of 2022.
Travel stood out among discretionary categories. Lodging and Air Travel both added double digit bps to their share of consumer spending between January and May 2022, mostly because of limited travel last winter. Travel growth, however, continued into May and June, suggesting that consumers largely accepted the fuel price increases that airlines passed along.
…but Online Marketplaces are still winning compared to pre-pandemic
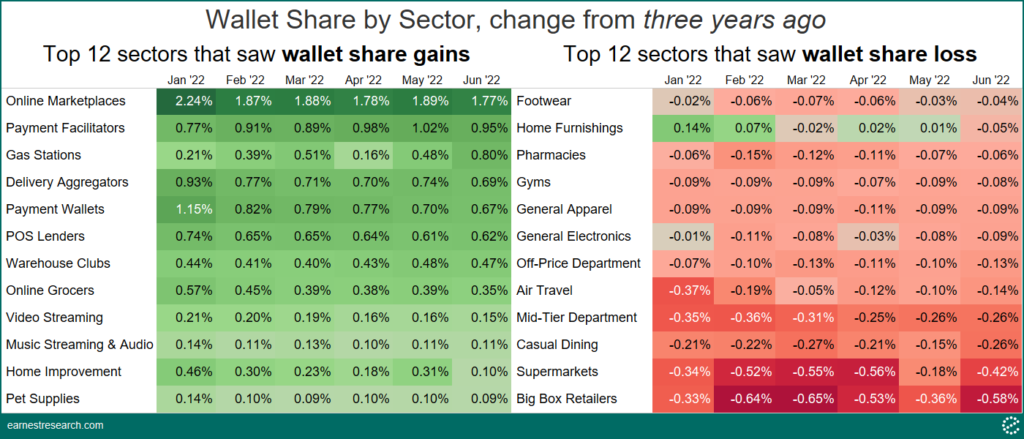
Notwithstanding these changes from one year ago, many structural changes from the pandemic are still manifest in the consumer’s wallet. The biggest change is the growth of the convenience economy. Online Marketplaces’ share (Amazon, eBay, etc.) is nearly 2 points higher than in 2019, although these gains have been slowing every month. Delivery Aggregators (DoorDash, Uber Eats, etc.) and Online Grocers, which added huge numbers of new customers in 2020, are also significantly higher.
Increases in convenience economy spending share since 2019 came at the expense of traditional mass retail categories Box Retailers and Supermarkets. Casual Dining, Department Stores, Apparel, and Gyms were still below pre-pandemic share levels in June 2022, reflecting a sustained change in in-person behavior. In the broader context of the pandemic, consumer spending online is still materially higher than it was three years ago.
Notes
*Methodology: Wallet share represents category spend divided by aggregate macro consumer spend (i.e. Earnest Analytics (FKA Earnest Research) cs_panel_spend table adjusted for ecommerce). Earnest Analytics (FKA Earnest Research) aggregate macro consumer spend has an 80% R-Squared with Census reported MRTS. Earnest Analytics (FKA Earnest Research) category spend includes thousands of companies across dozens of categories. Macro spend table includes all spending from panelists regardless of attribution to a category or company. SMB’s are largely absent in category spend but are captured in macro spend, potentially deflating a category’s true wallet share in the data. Macro spend excludes non-consumer spend such as checks, cash withdrawals, and large transfers, and therefore potentially misses rent and mortgage payments (note: Housing, the largest share of the consumer’s wallet, had 34.9% of wallet share in 2020 according to BLS figures). Net, net, however, Earnest Analytics (FKA Earnest Research) wallet share results are very much in line with reported BLS figures (linked above), in categories where comparisons are possible. Ex: BLS Food wallet share was 11.9% in 2020 vs. 12.2% in Earnest Analytics (FKA Earnest Research) data. Ex: BLS Gas wallet share was 2.6% in 2020 vs. 2.9% in Earnest Analytics (FKA Earnest Research) data.
