Back-to-Office, Back-to-Starbucks
Using Starbucks Foot Traffic to Measure Return-to-Office Behavior
The pandemic-driven transformation to working remotely was one of the biggest shakeups of the past year, the effects of which we are still witnessing today. With just over half the US population now vaccinated and many local economies reopened, the nature of remote work is top-of-mind: are employees returning back to the office, or will remote work be a sustained new reality in the post-pandemic workforce?
There are several ways to measure workers’ return to the office (keycard swipes, mass transit data), but one interesting proxy, which we’ve employed in this analysis, is consumer foot traffic to dense urban Starbucks locations near large office buildings.* We dug deep into individual Starbucks locations within our foot traffic dataset and looked at visitation behavior across ten major downtown hubs. We also drilled down into downtown New York City, Dallas, Chicago, and Miami, four cities with different cultures, office densities, and levels of COVID restrictions.
Key Takeaways
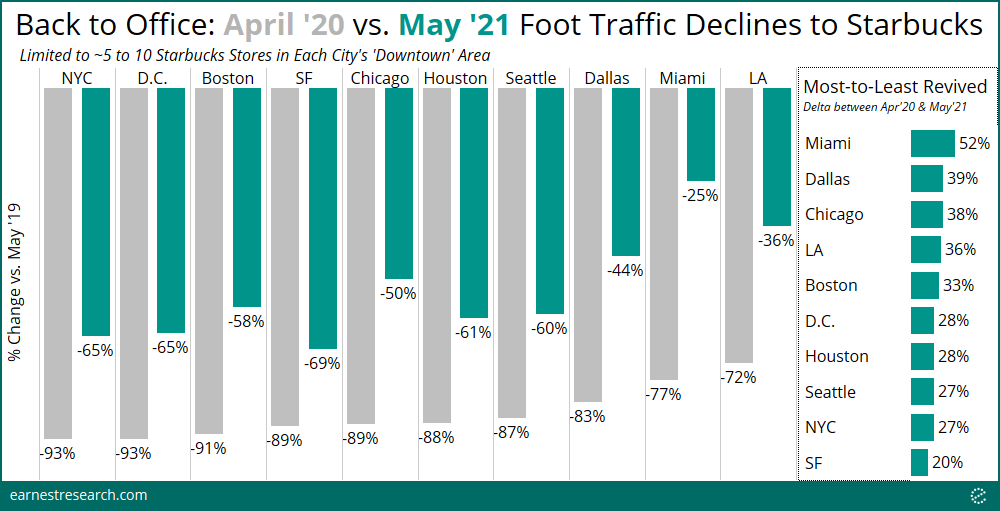
- Visits to Starbucks locations near office buildings in downtown Miami, Los Angeles, and Dallas are down ~25 to 45% vs. May ‘19 levels. Chicago, Boston, Houston, and Seattle visits are down ~50 to 60%, and D.C., New York City, and San Francisco stores are the most vacant, down ~65% to 70%.
- Miami and Dallas Starbucks hubs are most revived from their April ‘20 bottom, and so are Chicago’s, despite almost 90% declines last year. San Francisco is the least revived of the group.
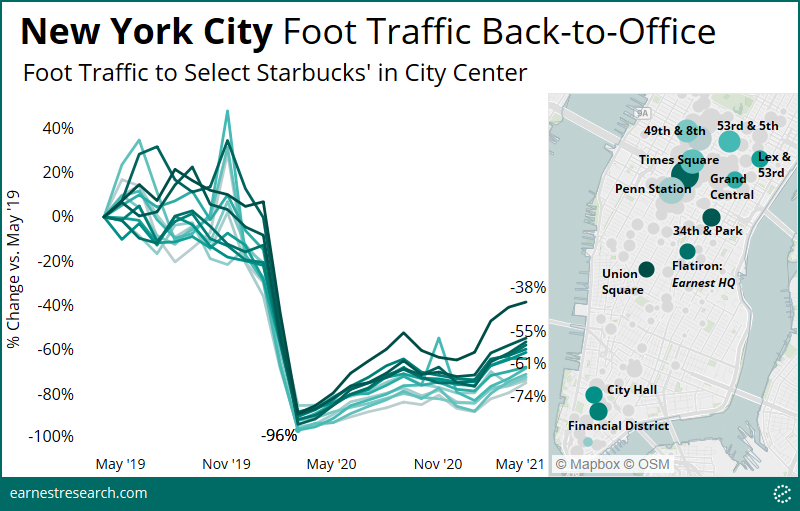
- NYC’s Penn Station, Times Square, and Grand Central Starbucks locations are down ~70 to 75%. Union Square saw quite a revival to ~40% declines last month. Most other NYC downtown locations are down ~55 to 65%. (In contrast, traffic to a group of NYC suburban Starbucks locations have returned to normal levels, +1% in aggregate).
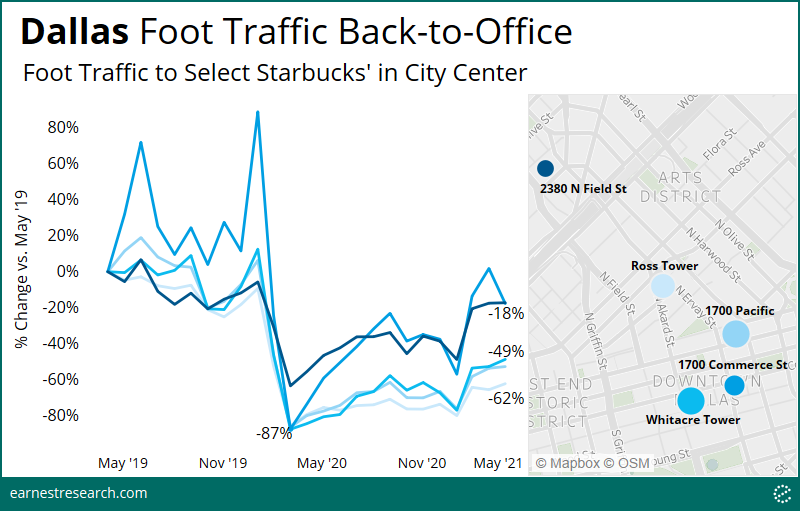
- Dallas’ Ross Tower is the most vacant in the city, with foot traffic declines at Starbucks of ~60%. Whitacre Tower (AT&T’s HQ) and 1700 Pacific stores are down ~50%, and 1700 Commerce (the base of a Hampton Inn) and the more uptown location on North Field St. are both [only] down ~20%.
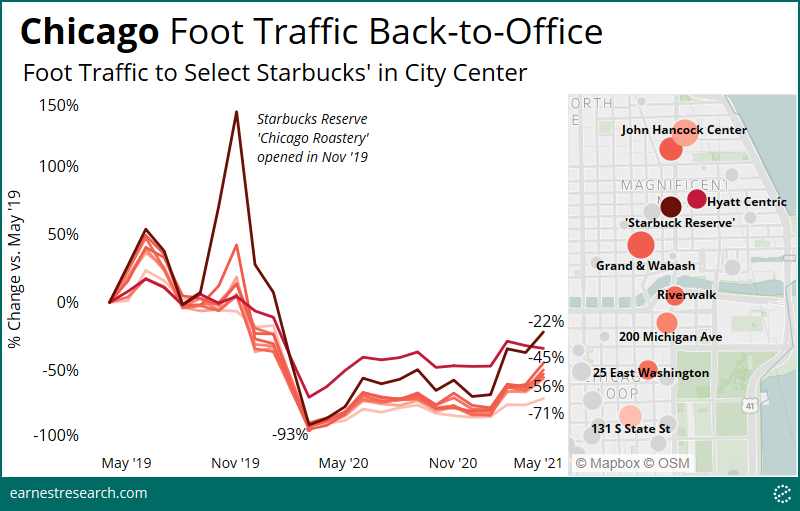
- Traffic to most downtown Chicago Starbucks locations are down ~50% to 70%. The John Hancock Center and stores inside the Loop are trailing last, while the very busy location on Grand and Wabash is pushing ahead. The Starbucks Reserve Chicago Roastery and the location inside the Hyatt Centric Chicago Magnificent Mile Hotel are both outperforming, declining 20% and 35%, respectively.
- Downtown Miami Starbucks stores are closest to “normal” levels. The most revived locations include the one across from the SunTrust International Center (down 15%) and in The Shops at Mary Brickell Village (down 18%). The location at the InterContinental Miami Hotel at Chopin Plaza is reasonably behind (down 44%) due to its heavier reliance on tourism.
Overview
Relative to May ‘19 foot traffic, visits to Starbucks locations near office buildings in downtown Miami, Los Angeles, and Dallas are down ~25 to 45% as of May ‘21, with Miami seeing the most revived visits of the group. Chicago, Boston, Houston, and Seattle are down ~50 to 60%, and D.C., New York City, and San Francisco are the most vacant, down ~65% to 70%.
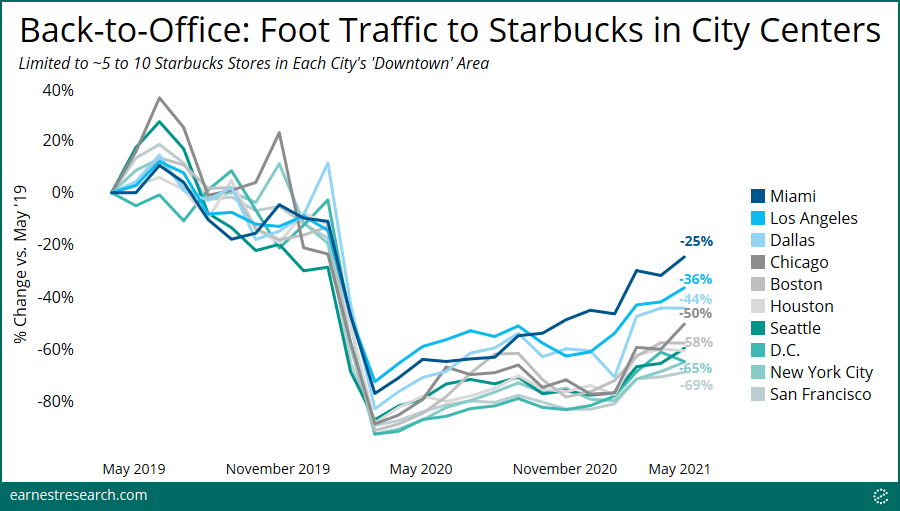
However, visitation behavior to Starbucks stores across these ten cities bottomed at different levels during the height of the pandemic. Los Angeles, Miami, and Dallas foot traffic dropped ~70 to 80% while most of the other cities bottomed further at 90%+. Focusing on the delta between May ‘21 and April ‘20’s bottom to assess revival, Miami and Dallas appear most revived, but notably so does Chicago, despite the Windy City bottoming hard at ~90% declines last year. San Francisco bottomed at ~90% as well, and continues to see the least revived traffic of the group.
Cities Deep Dive
New York
New York City is one of the least revived cities, trailed only by San Francisco, with 65% declines in traffic vs. May ‘19 levels.
Some of the most vacant Starbucks locations include Penn Station, Times Square, and Grand Central Terminal where traffic is down ~70 to 75%. This is in contrast to Union Square, which saw quite a revival to ~40% declines last month. Most other locations are down ~55 to 65% (including the one at Flatiron near Earnest HQ).
Penn Station, Times Square, and Grand Central are NYC’s biggest hubs, hosting dense local office traffic but also huge swaths of commuters and tourists on a (pre-pandemic) typical day; it is therefore reasonable for these locations to be most behind.
Dallas
Of the most revived cities, Dallas is down 44% in aggregate, and is the second to most revived city, surpassed only by Miami.
The Starbucks located at the base of Ross Tower, a major office building in downtown Dallas, is the most vacant, with foot traffic declines of ~60% relative to May 2019 levels. Whitacre Tower (AT&T’s HQ) and 1700 Pacific are down ~50%, while 1700 Commerce (base of a Hampton Inn) is down [only] 20%.
All three of these locations bottomed at just under ~90% declines in April ‘20. In contrast, the more uptown location on North Field St. is also only down ~20%, but this location never bottomed as hard, falling just ~60% in April ‘20.
Chicago
Still down ~50% from May ‘19 levels, but among the quickest cities to revive in this group, traffic to particular Starbucks locations vary widely across the Windy City.
Outliers at the upper end include two arguably tourist-heavy destinations: traffic to Starbucks’ premium “Reserve” line at its Chicago Roastery (down ~20%), and inside the Hyatt Centric Chicago Magnificent Mile Hotel (down ~35%). The Chicago Roastery bottomed at ~90% declines last year, and is thus the most revived location to date. (It’s also interesting to note its spike to ~140% after its official launch in November 2019). The Starbucks inside the Hyatt, while outperforming, only bottomed at ~70% declines last year.
Besides these outliers, traffic to most other Chicago locations are down ~50% to 70%. Trailing behind include the 100-story John Hancock Center, and most locations inside the Loop (131 S State St, 200 Michigan Ave, 25 East Washington, 333 Michigan Ave/Riverwalk), all of which are climbing up from their ~90% declines last year. The location on Grand and Wabash is typically one of the busiest locations, and is currently at the top of this revived list, at [just] 45% declines.
Miami
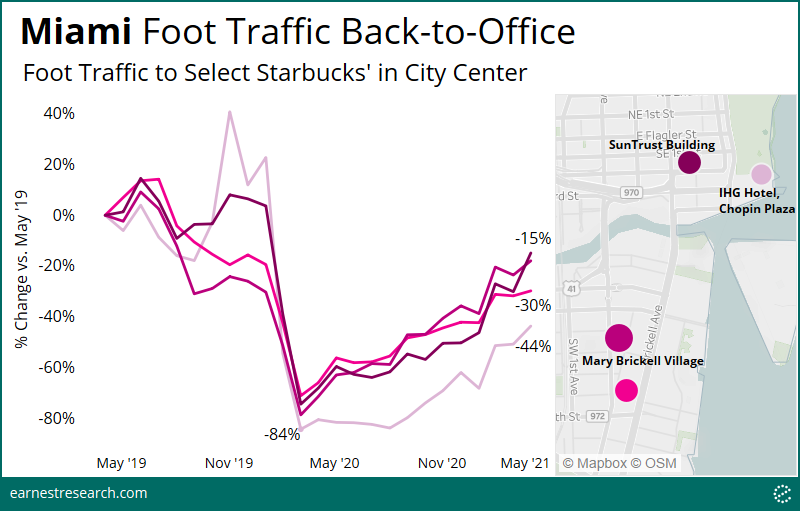
Downtown Miami is the closest to “normal” levels, with declines of just ~25% in aggregate.
The most revived locations include the one across from the SunTrust International Center (down 15%) and one in The Shops at Mary Brickell Village (down 18%). The location at the InterContinental Miami Hotel at Chopin Plaza is reasonably trailing behind, with declines of 44%, given its higher sensitivity to tourist traffic.
Starbucks in the Suburbs
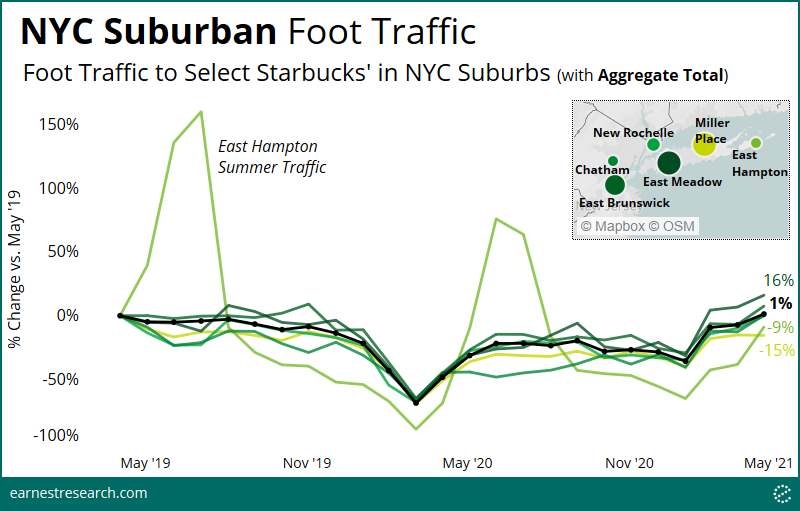
To reinforce the idea that visits to downtown Starbucks locations are a good proxy of back-to-office behavior, we benchmarked to a select group of suburban locations, and calculated their foot traffic accordingly. We selected NYC – where Earnest is headquartered – as our sample proxy and identified locations across various NYC suburbs that are precisely not near commuter train stations and/or bus stops (otherwise we would fall victim to measuring the same thing: commuting back to the office).
In clear contrast to downtown NYC, traffic to a group of NYC suburban locations have returned to normal levels last month (+1% in aggregate). East Meadow, East Brunswick, Chatham, and New Rochelle are seeing the same levels of traffic or higher relative to May ‘19 (East Meadow is outperforming the group at +16%). On the other hand, East Hampton and Miller Place in Suffolk County are still declining 10 to 15%; down indeed, but nowhere near the ~65% levels in downtown NYC.
Notes
*Methodology: Making an intellectually honest inference from Starbucks visitation behavior to workers’ return-to-office requires an intimate knowledge of urban centers and their downtown office layout. Our methodology for choosing particular Starbucks locations as representatives of back-to-office behavior involved identifying stores that were located in “downtown” hubs near large office buildings, as indicated by their locations on a map, as well as locations that had the highest consumer traffic during the full year of 2019 (with some exceptions).
