A Stunted (But Higher Priced) Back to School Season: Part 2
We have refreshed our back to school (B2S) analysis (read Part One) now that the full season is behind us, and added a detailed analysis on discounting and average selling price (ASP) trends utilizing our newest Retail Pricing data. This web-sourced sku-level dataset will be featured in our upcoming product Earnest Retail Pricing, which tracks retailers’ pricing and discounting trends, providing insight into gross profit margins.
Key Takeaways
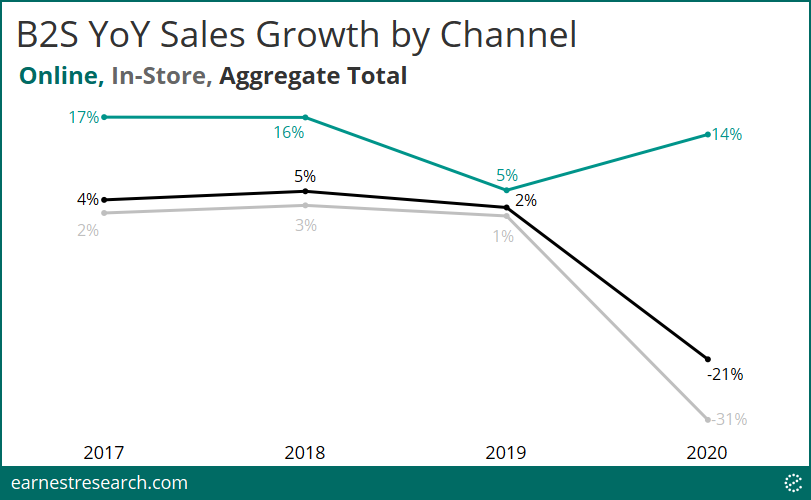
- The full B2S season declined 21% YoY this year relative to the ~2 to 5% growth seen historically. In-store sales growth slowed ~30 points while online sales growth accelerated 10 points.
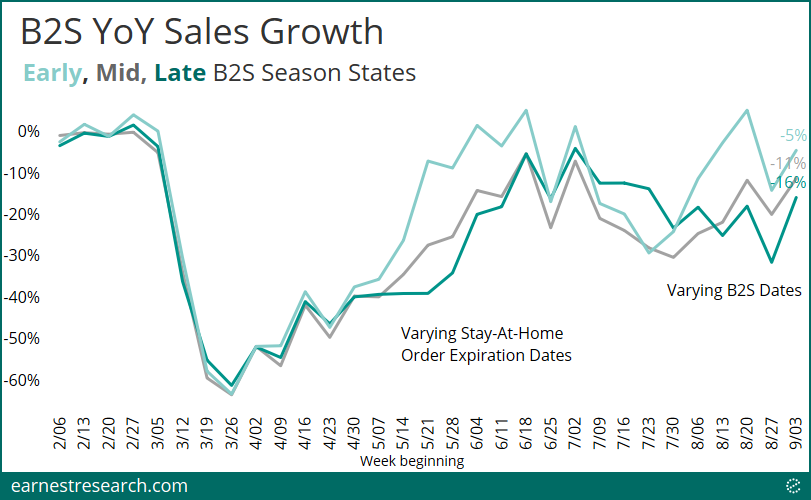
- Regionally, performance was staggered over the season’s five-week period, in line with the varying school start dates across the country. Interestingly, the states that typically open their schools earlier in the season saw nominal outperformance, both online and in store, relative to the rest of the country.
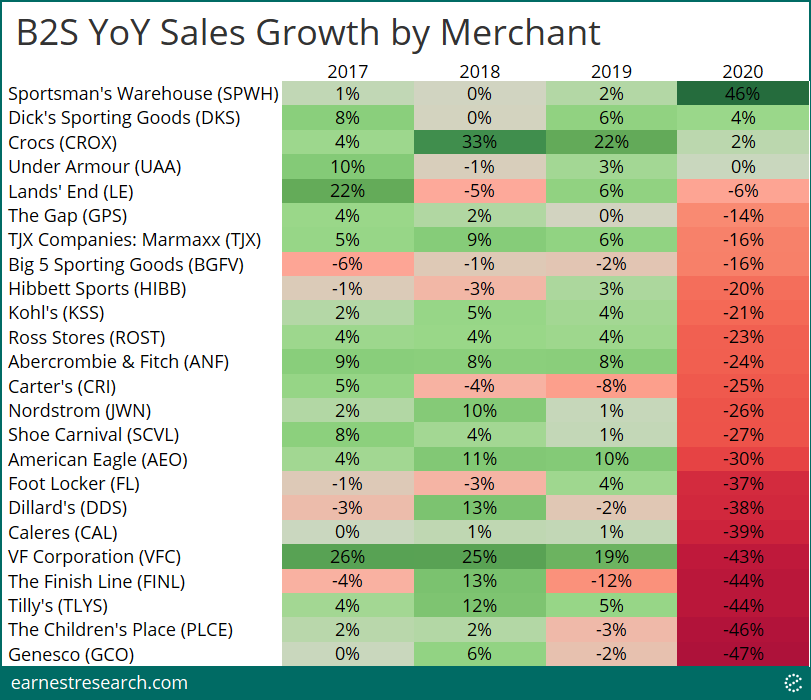
- Sportsman’s Warehouse, Dick’s, and Under Armour were of the few retailers that saw relatively healthy performance this B2S season in a sea of massive YoY declines. Retailers that were hit especially hard include Crocs, TJX’s Marmaxx, Abercrombie, American Eagle, VF Corp, Tilly’s, The Children’s Place, and Genesco.
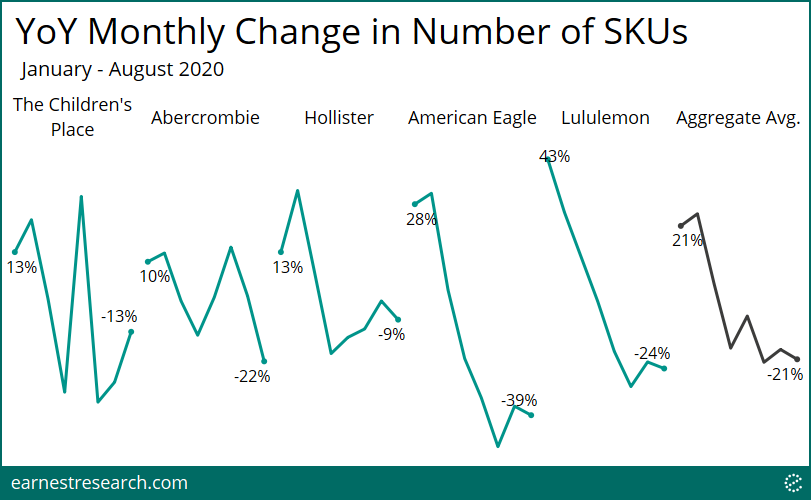
- Price tags (ASPs) in August for a handful of retailers were 12% higher than last year, largely due to a decrease in promotional activity, which followed the more promotional months of March and April. But what appears to be a recovery of demand is actually an intentional tightening of supply: the same retailers have significantly reduced their assortments this year, with the number of product variants (SKUs) for sale slowing from +21% YoY in January to -20% in August—a strategy that aims to protect margins by selling fewer items with lower discounts.
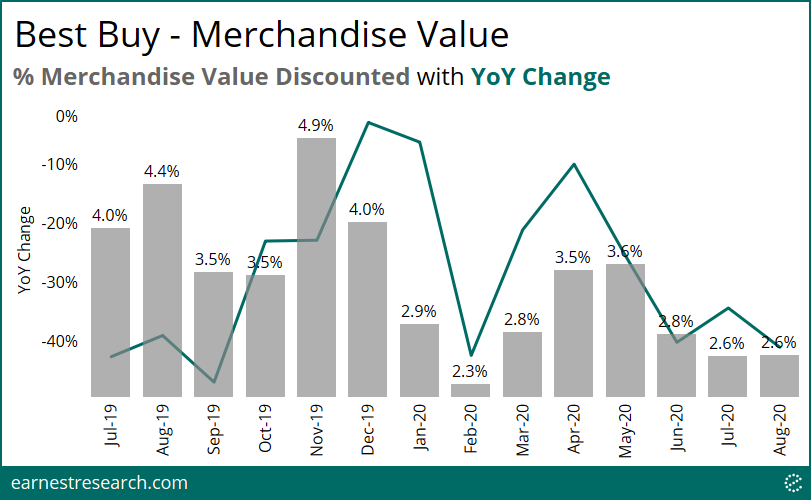
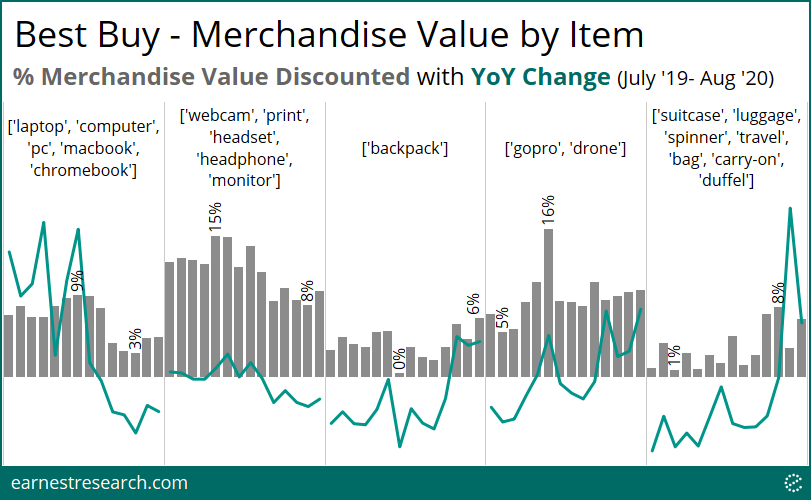
- Best Buy has been able to successfully decrease promotional activity relative to last year as the overall % of merchandise value discounted was down 41% YoY in August. By category item, work-from-home and study-from-home related products (laptops, webcams, etc.) were key drivers of this trend, but were partially offset by backpacks, suitcases, and other outdoor/travel items which saw increased promotional activity over the same period.
A Slow and Staggered Season
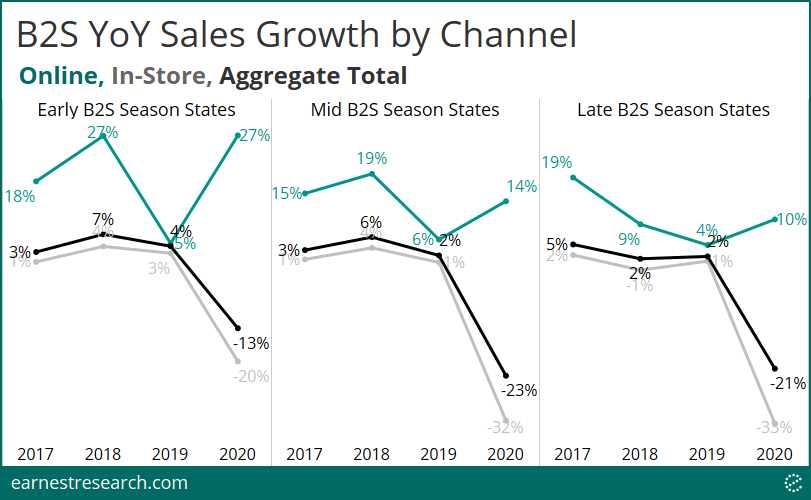
The full back to school season (defined as the trailing five weeks ending Labor Day across ~25 traditional retailers*) declined 21% YoY this year, a sharp contrast to the ~2 to 5% growth seen in prior years. In line with Covid behavior, in-store sales growth slowed ~30 points while online sales growth reversed course and accelerated 10 points.
As anticipated, the staggered nature of the season was manifest across regions, as states that opened their schools early** saw nominally more growth earlier in the season, and the rest of the country followed behind up to Labor Day accordingly. Interestingly, sales performance in these early-season states were stronger both online (+27% YoY) and in-store (-20% YoY) relative to the rest of the country, but were still down 13% YoY in aggregate.
Clearly this B2S season is yet another example of where regional trends diverged; the first being when different stay-at-home order expiration dates were implemented post lockdown across the country.
A Sea of Red
The vast majority of retailers saw material YoY declines, with the few bright spots being Sportsman’s Warehouse (partly attributed to firearms/ammo), Dick’s, and Under Armour. Retailers that in prior seasons saw relatively healthy growth, such as Crocs, TJX’s Marmaxx, Abercrombie, American Eagle, VF Corp, and Tilly’s, suffered massive declines this year with their growth slowing over 20 points due to the pandemic’s disruption.
[The below uses Earnest Retail Pricing Data]
B2S Retail Prices Healthy; Assortments Slashed
Despite the impact of the pandemic on retail sales, ASPs have been growing on a YoY basis for most apparel retailers through the back to school season. On average in August, prices were 12% higher across the websites of key back to school apparel retailers, including Abercrombie, Hollister, American Eagle, Lululemon, and The Children’s Place.
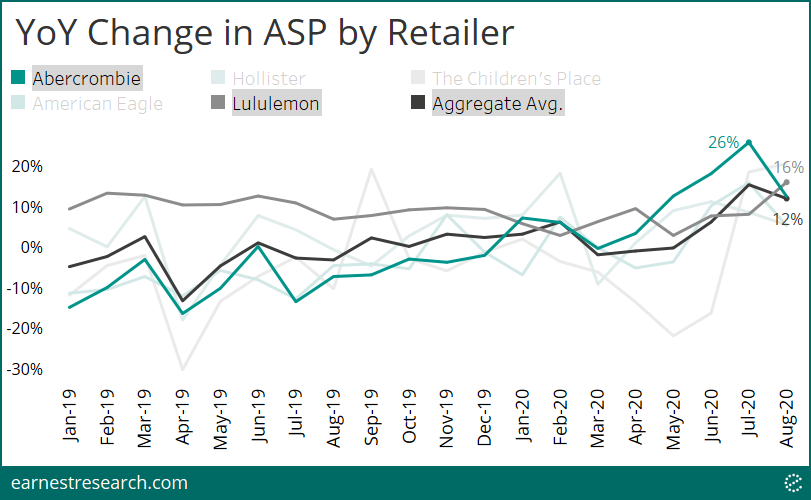
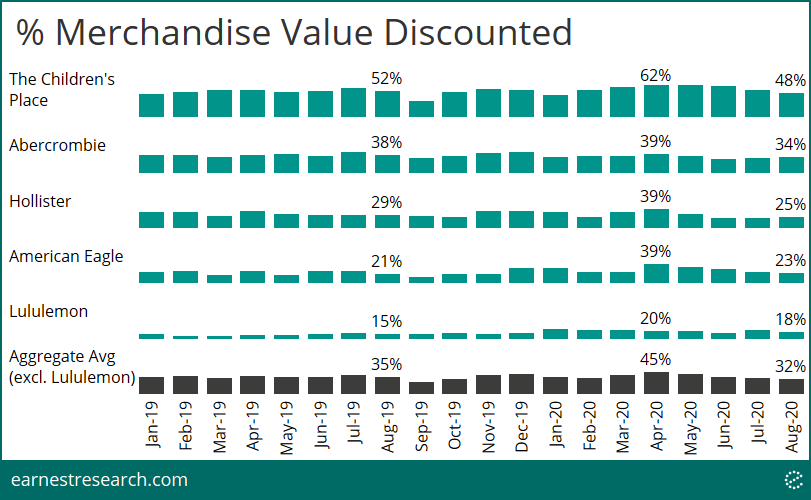
The higher prices observed over the summer were mostly driven by a decrease in discounting, following the more promotional months of March and April. Total % Merchandise Value Discounted – measuring the overall level of discounting across retailers’ merchandise (including both full-price items and on-sale items) – was 32% on average in August (excl. Lululemon), down from 45% in April and 35% at the same time last year.
While the promotional environment appears to be healthy, it’s in the context of significantly reduced assortments. The number of product variants (SKUs) sold at these retailers went from +21% YoY in January to -21% YoY in August as retailers protected margins across fewer items.
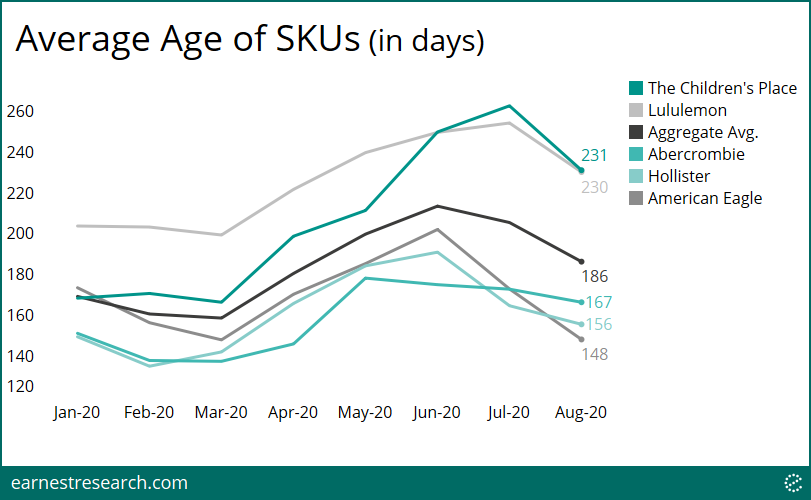
Lastly, with fewer, more careful product releases since the start of the pandemic, the average age of SKUs has increased by 25 days, from 161 days in February to 186 days in August.
Best Buy Gets Straight As
Best Buy entered the back to school season already getting straight As. The electronics retailer has been able to decrease promotional activity since last year and since the start of the pandemic, and is currently seeing a 41% YoY decrease in % merchandise discount for August.
Looking at specific baskets of items, discounting of work-from-home and study-from-home setups decelerated sharply since the start of the pandemic. For August, the average % merchandise value discounted was down 45% YoY for laptops & computers, and down 28% for webcams, headphones and monitors.
In contrast, a number of out-of-favor categories saw increased promotional activity in August. Average % merchandise value discounted was up 47% YoY on backpacks, a traditional back-to-school category, 71% on travel items (suitcases & luggage), and 89% on other outdoor and travel purchases (e.g GoPro, drones).
Notes
Earnest Retail Pricing is currently in beta phase; it is slated to be on the market later this year. Please reach out to learn more.
*See our piece from last year here on how we defined the B2S retail market
**Early season states include: Alabama, Arizona, Colorado, Idaho, Kentucky, Mississippi, Montana, Nevada, New Mexico, Tennessee, Utah, Wyoming. Mid-season states include: Alaska, Arkansas, California, Florida, Georgia, Hawaii, Illinois, Indiana, Iowa, Kansas, Louisiana, Michigan, Minnesota, Missouri, Nebraska, North Carolina, North Dakota, Ohio, Oklahoma, Oregon, Puerto Rico, South Carolina, South Dakota, Texas, Washington, Wisconsin. Late season states include: Connecticut, Delaware, District of Columbia, Maine, Maryland, Massachusetts, New Hampshire, New Jersey, New York, Pennsylvania, Rhode Island, Vermont, Virginia, West Virginia.
