DoorDash’s Future of “Local”
In anticipation of DoorDash’s IPO, we reviewed statements made in the company’s S-1 and compared them with our spend data of millions of de-identified US consumers.
Key Takeaways
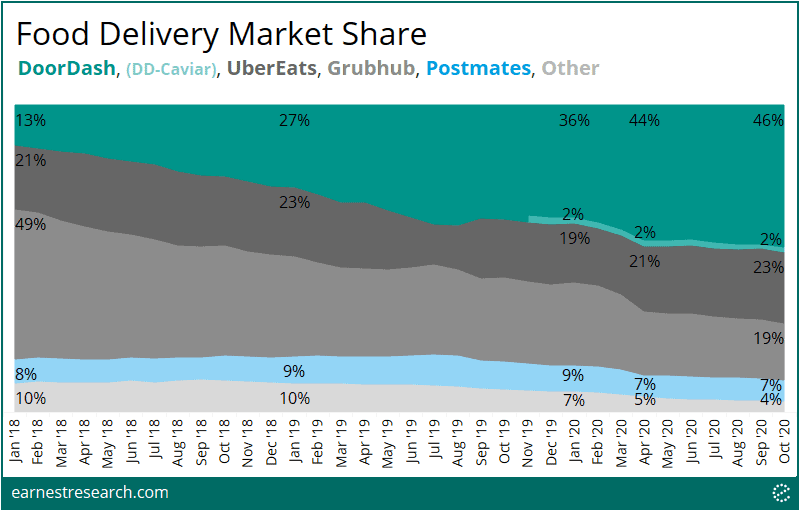
- In-line with what’s referenced in the S-1, our data shows DoorDash captured nearly 50% of the food delivery market, an impressive ~35 point increase since January 2018. Grubhub was the primary victim, with its share going from 49% to 19% over the same period.
- Growth was more pronounced in suburban/smaller metro areas (i.e. outside of Tier 1 cities), growing share by ~37 points vs. ~22 points in Tier 1 cities since Jan 2018.
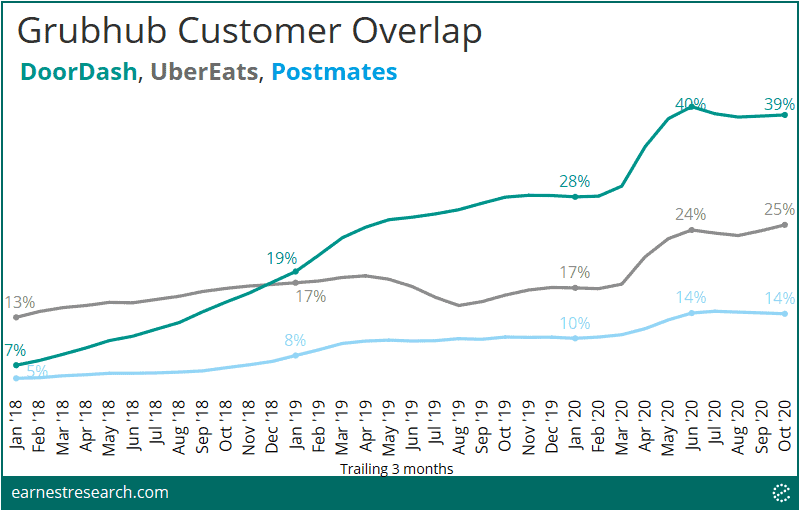
- In early 2018, just 7% of Grubhub’s customers were also using DoorDash, a number that has now reached ~40%.
- New 2Q20 (Covid) customers spent over $300 cumulatively over six months; a sharp increase relative to the ~$200 six-month cumulative spend for the 2Q19 and 2Q18 cohorts.
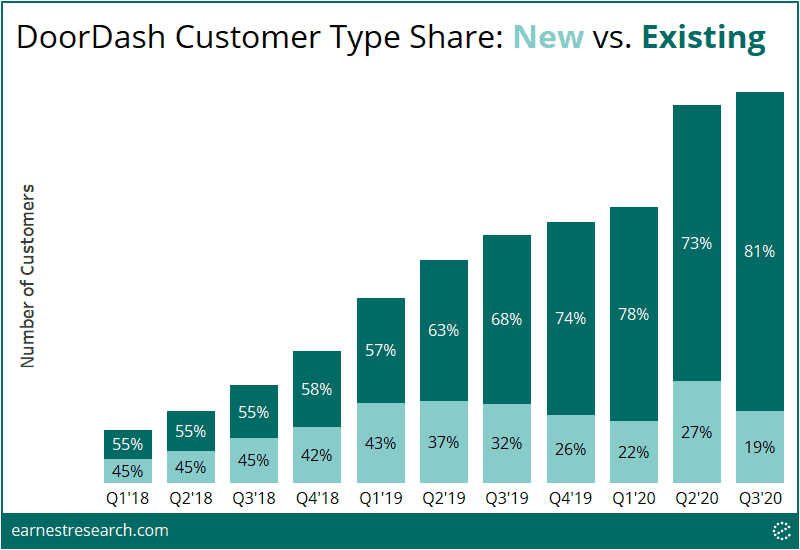
- Existing customers represented ~80% of customers in 3Q20, versus a relatively even 55/45 (existing/new) split throughout most of 2018.
The Suburban-Driven Winner
“We have experienced rapid growth since our founding. Our merchant-first approach…has propelled us to the leading position among U.S. local food delivery logistics platforms. We are proud to reach over 85% of the U.S. population and have 50% category share among U.S. local food delivery logistics platforms, which is 24 percentage points more than our next closest competitor…Our category share lead over other U.S. local food delivery logistics platforms is even greater in suburban markets, where we currently have 58% category share.”
DoorDash S-1
The share of food delivery spend on the DoorDash platform reached 48% (= 46% + Caviar’s 2%) as of October 2020; an impressive ~35 point increase since January 2018 (the S-1 references 17% share in Jan ‘18 growing to 50% in Oct ‘20). Its share growth came mainly at the expense of Grubhub and other (smaller) players, while UberEats and Postmates’ share remained largely flat over the past three years. (Note: Uber’s acquisition of Postmates reportedly closed on 12/1/20).
DoorDash’s S-1 notes that suburban markets and smaller metropolitan areas are underserved areas with regard to food delivery, and implies that therein lies opportunity for DoorDash. Indeed, since Jan ‘18, DoorDash has seen its share growth more pronounced outside of Tier 1 cities*, growing its share by ~37 points in the rest of the country (RoC) vs. the ~22 points in Tier 1 cities. In the RoC, ~10 to 15 points of share were taken from both Grubhub and UberEats individually, while Grubhub was largely the exclusive victim in Tier 1 cities, its share halving over the same period.
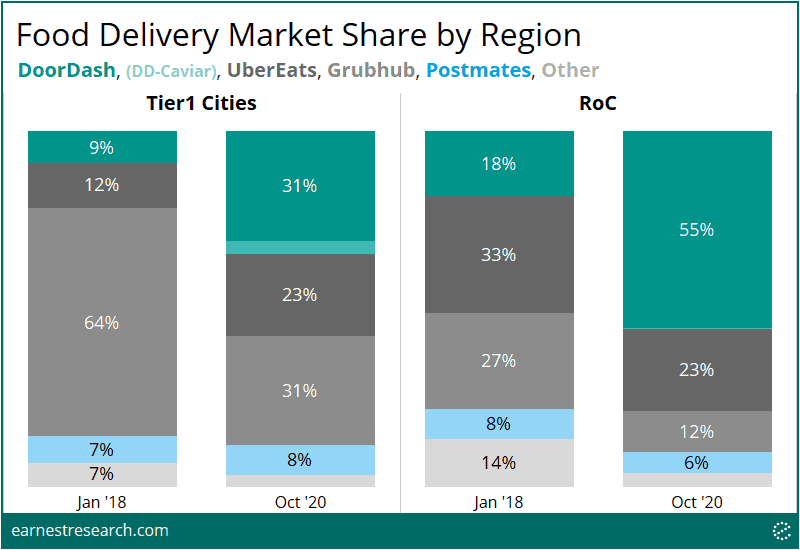
Other platforms include: Amazon Restaurants, Bite Squad, Chowbus, Delivery Dudes, Delivery.com, EatStreet, Food Dudes Delivery, Fooda, Foodsby, Goldbelly, Just Eat-SkipTheDishes, MealPal, Munchery, Ritual, Slice, Territory, Thistle, Waitr, ezCater. Grubhub includes Grubhub, Seamless, Eat24, OrderUp, Foodler, and Tapingo.
Promiscuous Patrons
“The markets in which we operate are intensely competitive and characterized by shifting user preferences, fragmentation, and frequent introductions of new services and offerings…In addition, within our industry, the cost to switch between offerings is low. Consumers have a propensity to shift to the lowest-cost provider and could use more than one local logistics platform.”
While the food delivery market is indeed characterized by shifting user preferences, DoorDash has been the beneficiary platform to date. We zoomed in on the customer behavior of the market’s primary incumbent, Grubhub, specifically looking at what percent of Grubhub’s customers have been spending money on competitor platforms over the years. In early 2018, just 7% of Grubhub’s customers were also on DoorDash, 13% on UberEats, and 5% on Postmates. This rate of promiscuity markedly increased over the past several years, with ~40% of Grubhub’s customers now spending on the DoorDash platform, as well as 25% on UberEats, and 14% on Postmates.
Covid Lifetime Value
“The pandemic has had a significant impact on merchant demand and consumer purchase patterns, largely due to mandatory shelter-in-place orders and restrictions on in-restaurant dining.”
Covid restrictions and housebound behavior had a clear positive impact on DoorDash’s Customer Lifetime Value (CLTV). New 2Q20 customers began spending at a slightly higher ticket coupled with more frequent purchases, driving cumulative spend over $300 after six months, vs. approximately $200 six-month cumulative spend for the 2Q19 and 2Q18 cohorts. We also saw increased Covid-related spending in these older cohorts, pushing their cumulative spend up sharply during the pandemic months.

Rinse and Repeat
“As consumers make DoorDash a regular activity, repeat use has resulted in a greater proportion of our Marketplace GOV being generated by existing consumers on our platform…Marketplace GOV from existing consumers increased from 68% in the third quarter of 2018 to 85% in the third quarter of 2020.”
Looking at the breakdown of new vs. existing customers on the platform, what used to be a relatively even 55/45 (existing/new) split in 2018 shifted to 80/20 split in 3Q20. Interestingly, the onset of the pandemic in 2Q20 brought in the highest number of new customers on the platform since 2018, causing an unprecedented reversal of the trend of repeat customers taking up share.
