You Probably Owed Money to the IRS this Year
In late March, we investigated how changes to the tax code have impacted Americans across income brackets and geographies using credit, debit and bank deposit records from millions of anonymous US consumers. Our initial analysis incorporated data through March 13, 2019.
We have since updated our analysis to include tax payments in relation to refunds. We also analyzed total consumer spending behavior to understand the potential impact of the new tax code.
Key Takeaways
- While the 2019 tax season saw a decline in refunds and an increase in tax payments, both in number and in average size, this trend appears far more acute for high-income households.
- While the percentage of households that owed money to the IRS has increased over the last two years, this increase is more pronounced in 2019 for high-income and medium-income families.
- Considering the new limited deductions on state and local income tax (SALT), high-tax states in the Northeast and on the West Coast continue to be most impacted.
- Consumer spending has slowed ~1% so far this year. By income bracket, spending has slowed ~3% for high-income households but has accelerated ~2% for low-income households.
Smaller Payouts, Higher Dues
- Refunds: The IRS has released data that total number of refunds are down 0.9% YTD. We continue to see this drop as far more significant for households with take-home pay of over $100k, while households with take-home pay of less than $50k see a negligible change.
- Payments: Our data shows that the number of tax payments are up across all income brackets, though far less so for lower-income households.

- Refunds: The IRS reports that the average size of refunds was down 1.6% compared to last year. Broken down by income brackets, for households that received a refund in both 2018 and 2019, we see a more significant decrease for higher-income households.
- Payments: For those who owed money to the IRS in both 2018 and 2019, we see higher-income households most adversely impacted with their average payment size up 12.7%.

More Payments
Do more households owe money to the IRS? While the percentage of households that made a tax payment has increased over the last few years, this increase is more pronounced in 2019 for high-income and medium-income families.

Impact on the State Level
- Refunds: We observed the regional tax refund impact of limiting deductions on state and local income taxes (SALT) to $10,000. It is clear that states with high state income and property taxes continue to be most affected.
- Payments: Taxes paid increased most in high-tax states in the Northeast and on the West Coast.


Shopping Less
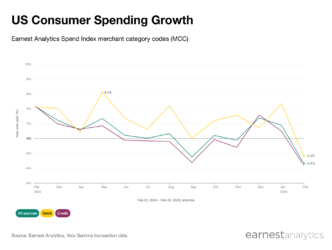
How is spend tracking in 2019 compared to 2018? Focusing on verticals most impacted by tax refunds – Apparel, Department, General Merchandise, Home, Restaurants and Specialty – our data shows that growth in spending is sequentially down 1.3% from 2018.

More specifically, our data suggests that higher-income households are driving the sequential slowdown in spending, as their spending declined ~ 1% YoY, a notable ~ 3% deceleration in growth from 2018. Conversely, lower-income households are seeing an acceleration in spending.
We conclude wondering if the inverse relationship between spending growth and income level is directly related to the new tax code.
Footnotes
For refunds or payments greater than $50,000, we set equal to $50,000 to limit outliers that may skew the data or transactions that may be for businesses rather than individuals or families.
Data as of 05/8/2019


