There’s No Place Like (a New) Home
The pandemic-defined year for the consumer was marked by volatile spending patterns, ceased foot traffic behavior, a much discussed urban exodus, among other unprecedented trends. We looked at our homebuilders data to see how new home orders across the country were impacted as well during this year of social distancing, remote life, and a potential move away from dense apartment living.
Key Takeaways:
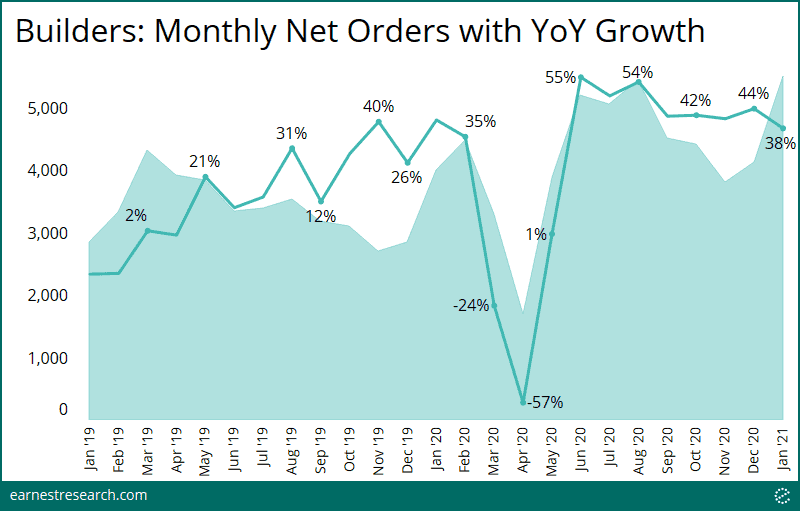
- Across US home builders’ data, new home orders grew at a frenzied pace (40%+ YoY) throughout the back half of 2020.
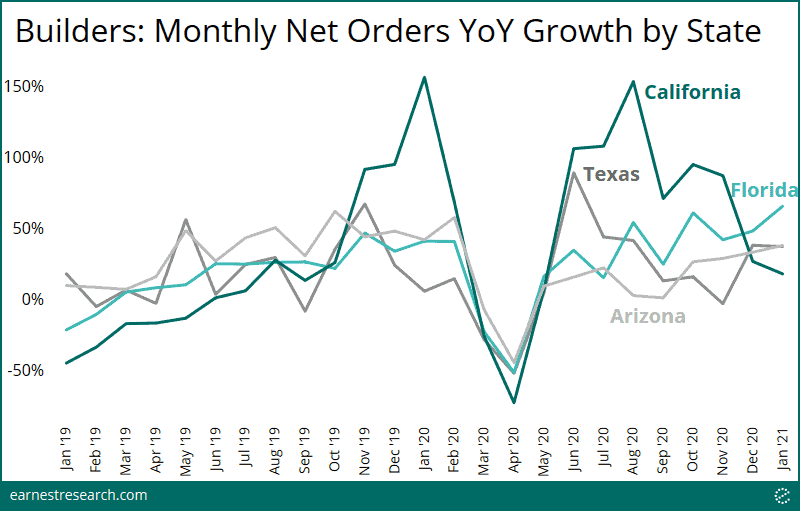
- There was meaningful strength across Arizona, California, Texas, and particularly Florida, which grew ~50% YoY in the past six months and continues to accelerate.
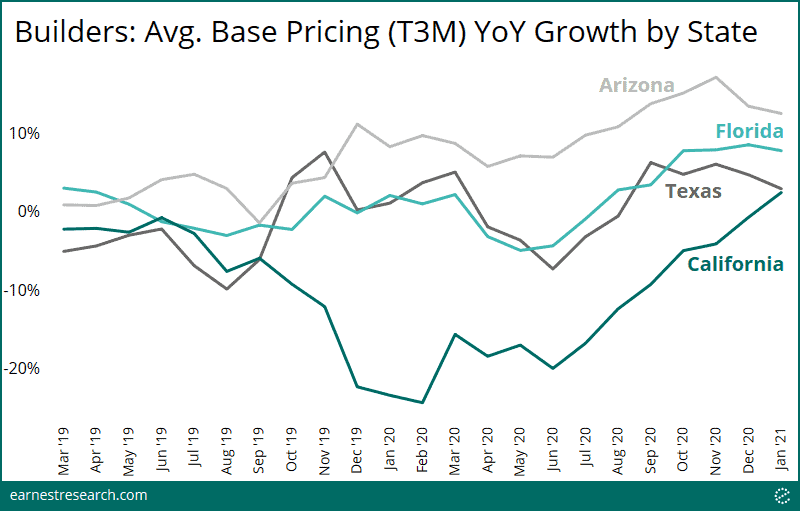
- Base prices were higher in California and Texas, and even more so in Arizona and Florida.
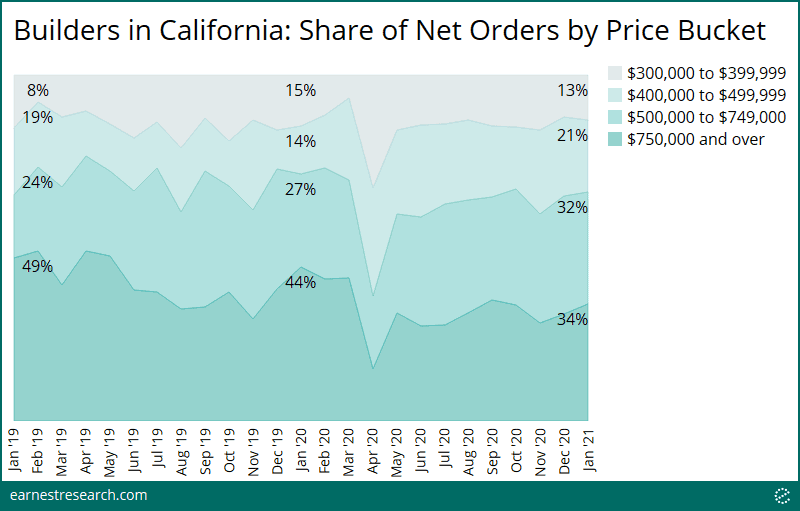
- The discussed Californian exodus from expensive areas of the state has resulted in more sales from lower price points than in years past.
Time to Move
Among the builders we track*, new home orders have been growing at a frenzied pace in the back half of last year. There was a slight deceleration in YoY growth in January, but with easier comparisons over the next 3 months, net order growth should continue its upward trajectory.
West, Central, and East
Looking at activity in Arizona, California, Florida, and Texas, there was meaningful strength across all of these markets. While California experienced the slowest growth relative to the other three states in January, home sales remain well above 2019 levels. Relative to levels we measured in January 2019, January 2021 orders are up 96% in AZ, 189% in CA**, 128% in FL, and 52% in TX.
How Much?
Further, there appears to be meaningfully higher base pricing across the four states listed above, driven by both a preference for higher-priced homes in these regions as well as prices increasing at the community level. Note, this pricing data will not capture changing incentives, lot premiums, or options included in each new home sale.
Looking particularly in California across various home price buckets, the much discussed exodus from expensive areas of the state seems to be playing out, as more sales are coming from lower price points than in years past.
Notes
*Earnest tracks over 1,200 public builder communities (over 5% of the market) to better understand new home sale trends. This collection of communities is well diversified across various geographies and price points, though does have a slight bias towards the South and West Census regions. This bias is fairly consistent with general new housing activity, but underrepresents much older northern markets.
**California is likely benefiting from a very easy comparison in January 2019, which was adversely impacted by the limitation of the SALT deduction as defined by The Tax Cuts and Jobs Act of 2018.


