September 2024 US Consumer Spending: fuel sales drag growth

Access chart in Dash.
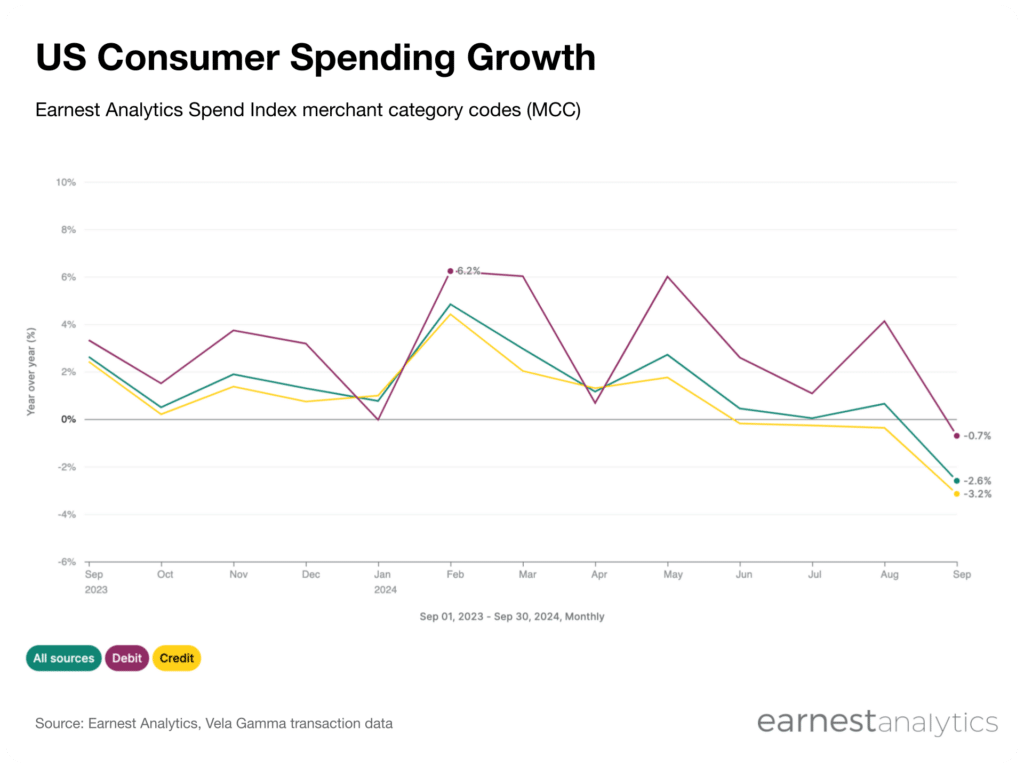
The Earnest Analytics Spend Index (EASI) powered by Vela Gamma transaction data fell in September to -2.6% YoY, with a slight deceleration in credit card spending adding to a larger deceleration in debit card spending.
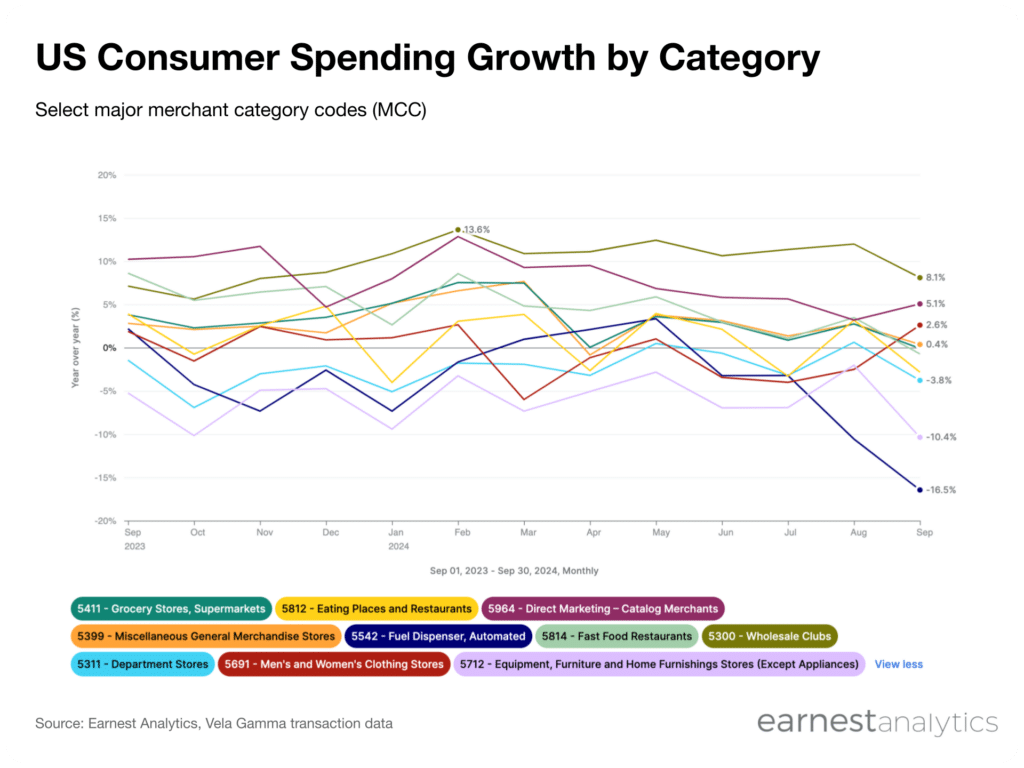
Results from major merchant category codes (MCC) in descending order of total sales:
- Grocery Stores, Supermarket (5411), which includes major grocers like Kroger and Publix, decelerated to -0.1% YoY growth
- Eating Places and Restaurants (5812), which includes casual restaurants like Olive Garden decelerated to -2.8% YoY growth
- Direct Marketing–Catalog Merchants (5964), which includes online ecommerce like Amazon and Temu, accelerated to +5.1% YoY growth
- Miscellaneous General Merchandise Stores (5399), which includes Walmart and Target, decelerated to -0.4% YoY growth
- Fuel Dispenser, Automated (5542), which includes Shell and Exxon, decelerated to -16.5% YoY growth
- Fast Food Restaurants (5814), which includes McDonald’s and Burger King, decelerated to -0.7% YoY growth
- Wholesale Clubs (5300), which includes Costco and Sam’s Club, decelerated to +8.1% YoY growth
- Department Stores (5311), which includes Nordstrom and Kohl’s, decelerated to -3.8% YoY growth
- Men’s and Women’s Clothing Stores (5691), which includes H&M and Abercrombie, accelerated to 2.6% YoY growth
- Equipment, Furniture, and Home Furnishings Stores except Appliances (5712), which includes Wayfair and Williams Sonoma, decelerated to -10.4% YoY growth

Access chart in Dash.
About the Earnest Analytics Spend Index:
The Earnest Analytics Spend Index (EASI) is an alternative data-driven measure of consumer spending that tracks spend across 89 merchant category codes (MCC), encompassing thousands of US merchants. The near real-time data is derived from the credit and debit spend of millions of de-identified US consumers. Advantages of using EASI include faster macro signals and insight into geographic, shopper income, and credit vs debit trends.
Historical numbers can vary due to methodology updates.
Request macro trends details


