IPO Roundup 2020
With several consumer-facing companies expected to IPO this year, we took a look at consumer spending to better understand the business health and competitive landscape for Airbnb, Doordash, Postmates, Instacart, Cole Haan, Topgolf and Casper.
Key Takeaways
- Airbnb. The gig economy hotel disruptor and largest IPO on the board has more than doubled its market share both within the hotel industry and the online travel agency industry in the last three years. The marketplace is supported by a guest-to-host ratio of 5:1, with the number of guests growing faster than the number of hosts. Our data shows hosts earning ~$1500/quarter on average, while guests pay ~ $650/quarter.
- Doordash. Currently commanding 39% of the on-demand food delivery market, it recently surpassed incumbent Grubhub. What’s telling: 30% of Grubhub diners are now dining with DoorDash, up from 5% just two and a half years ago.
- Postmates. Another on-demand delivery platform, Postmates is growing but not much faster than the rest of the market, maintaining roughly 10% share since early 2017.
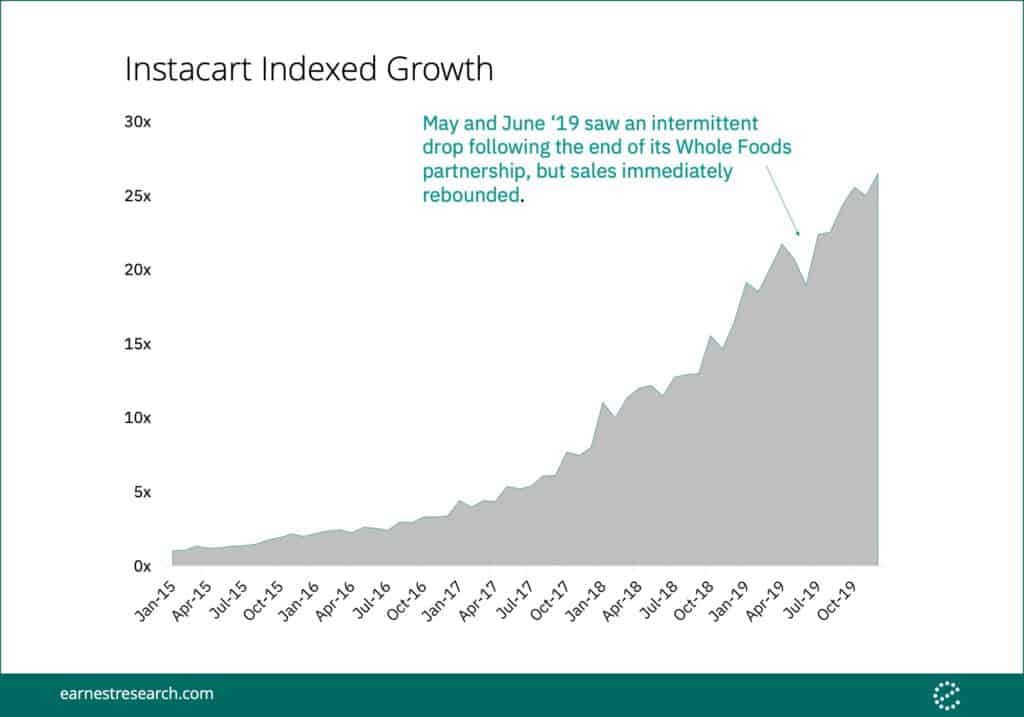
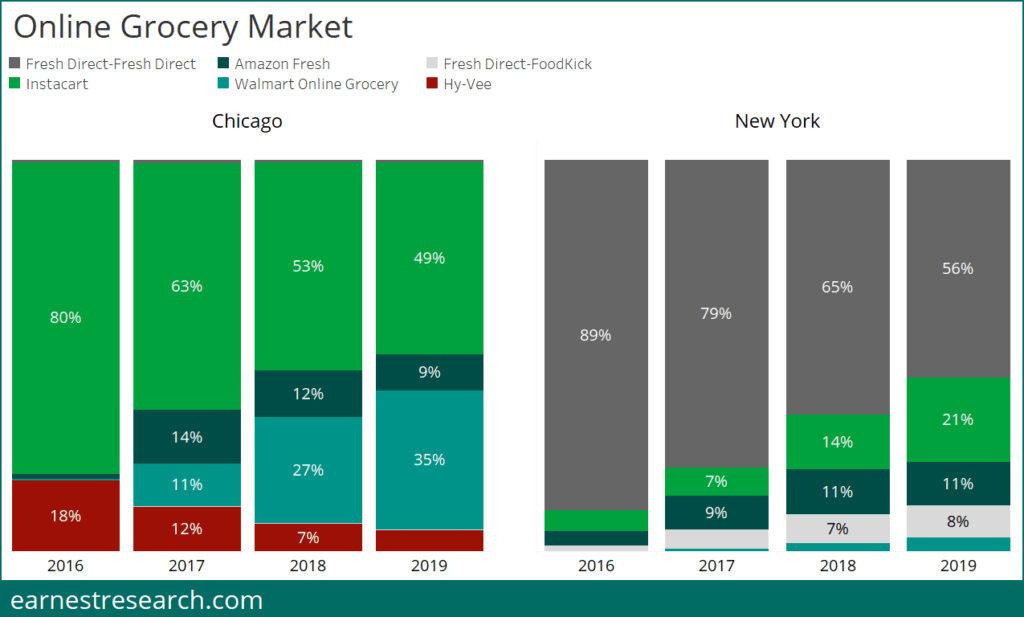
- Instacart. The online grocery delivery platform, competing with the likes of none other than Walmart and Amazon, has seen its platform grow an impressive ~25x since 2015. Yet, its success varies heavily by region, grabbing ~50% of Chicagoans’ online grocery wallet, but just ~20% of New Yorkers’.
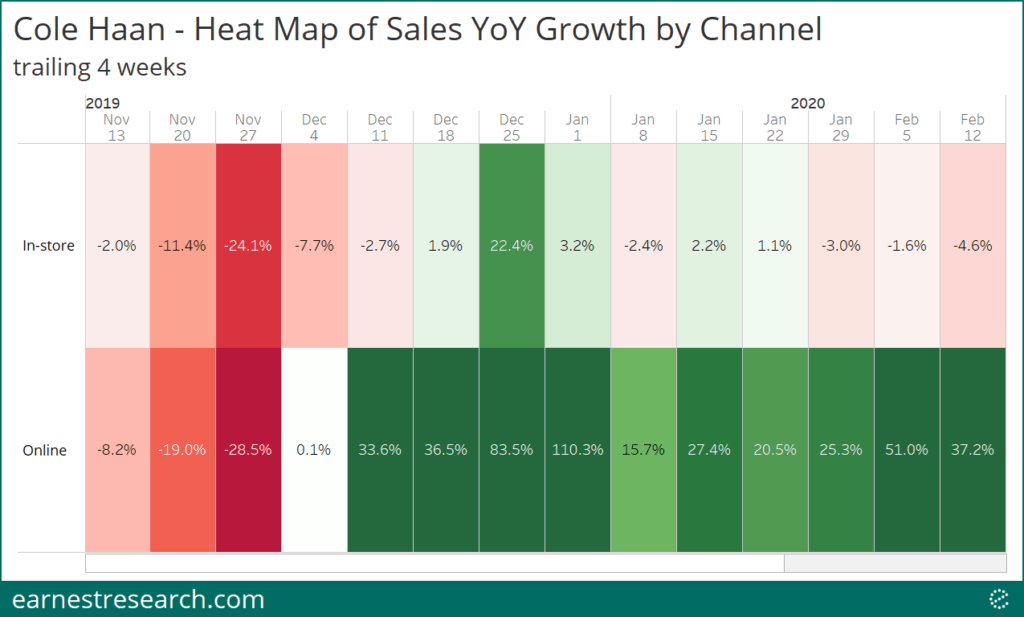
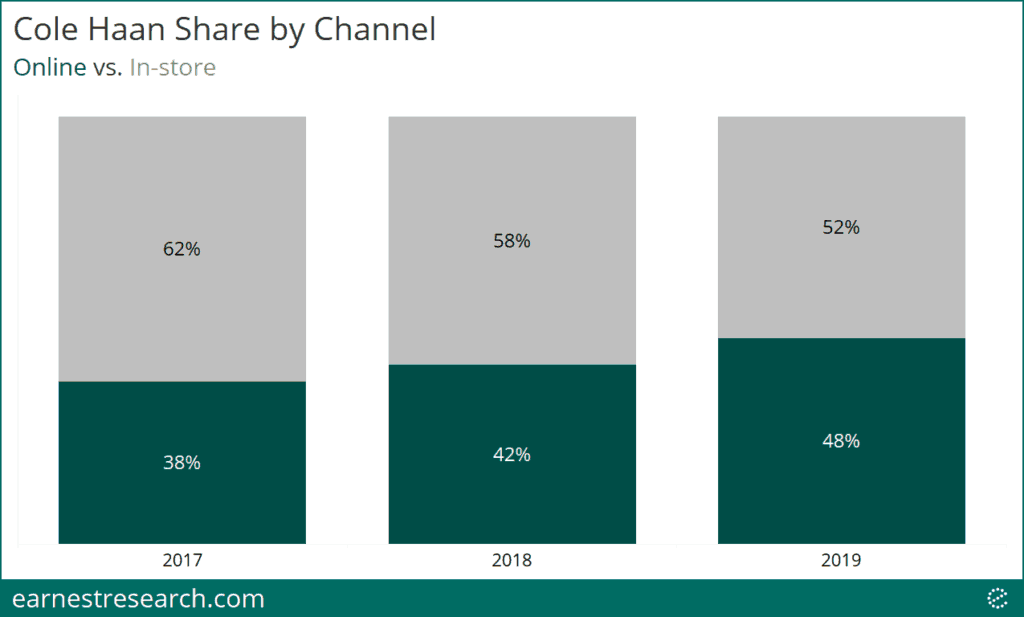
- Cole Haan. With a recently filed S-1, shoemaker Cole Haan is pushing its North American DTC channel with a focus on digital commerce at colehaan.com. Our data shows an impressive ~20% to 50% YoY growth on an already large base of digital sales, a base that is now just under 50% of total sales.
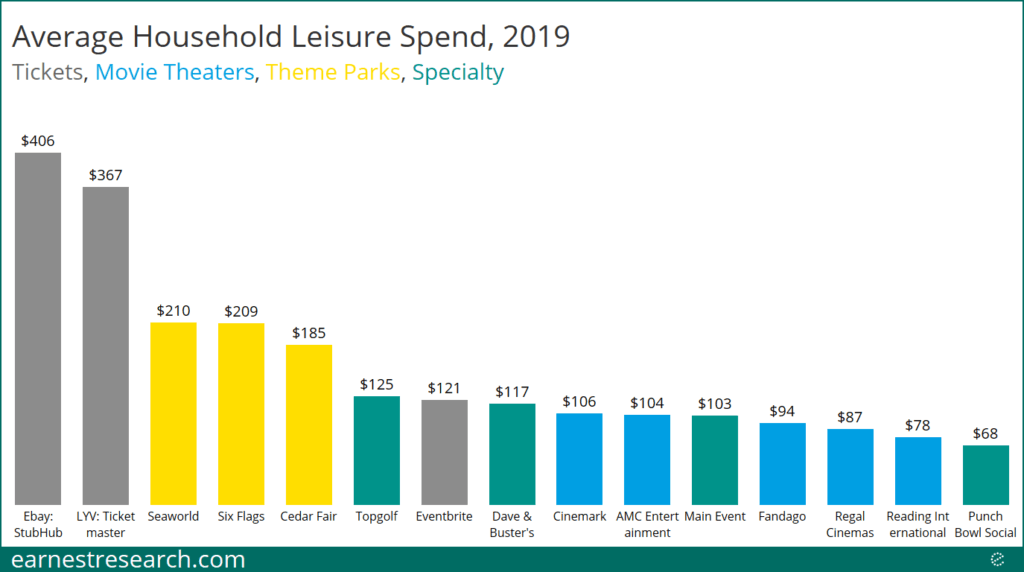
- Topgolf. This very niche golf entertainment company wants a part of your leisure wallet, a wallet that looks as follows: the average household laid out ~$80 to $100 on movie theaters, ~$200 on theme parks, and ~$400 on event tickets in 2019. This puts Topgolf’s ~$125 household budget inside that range, and slightly above its closer peers’ Dave and Buster’s ~$115 and Main Event’s ~$100.
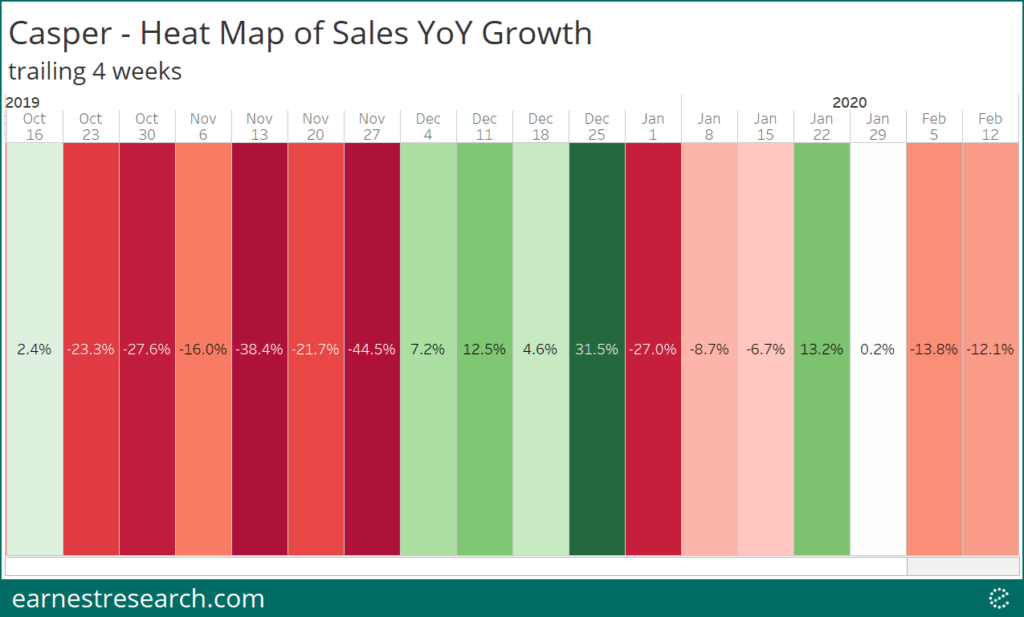
- Casper. We took another look at performance after writing about this IPO a few weeks ago: February is not looking too cozy for the now public mattress disruptor, but it’s still better than its October and November 20%+ YoY declines.
Airbnb
The largest anticipated IPO this year is Airbnb, the online lodging marketplace and gig economy hotel disruptor. We looked at Airbnb’s market share gains from the perspective of two markets: traditional hotels and online travel agencies. In both markets, Airbnb has more than doubled its share since 2016, now trailing hotel leader Marriott with 27% share of hotel spend, and trailing OTA giant Expedia with 42% of OTA spend (but double the next largest platform when each of Expedia’s platforms is broken out).
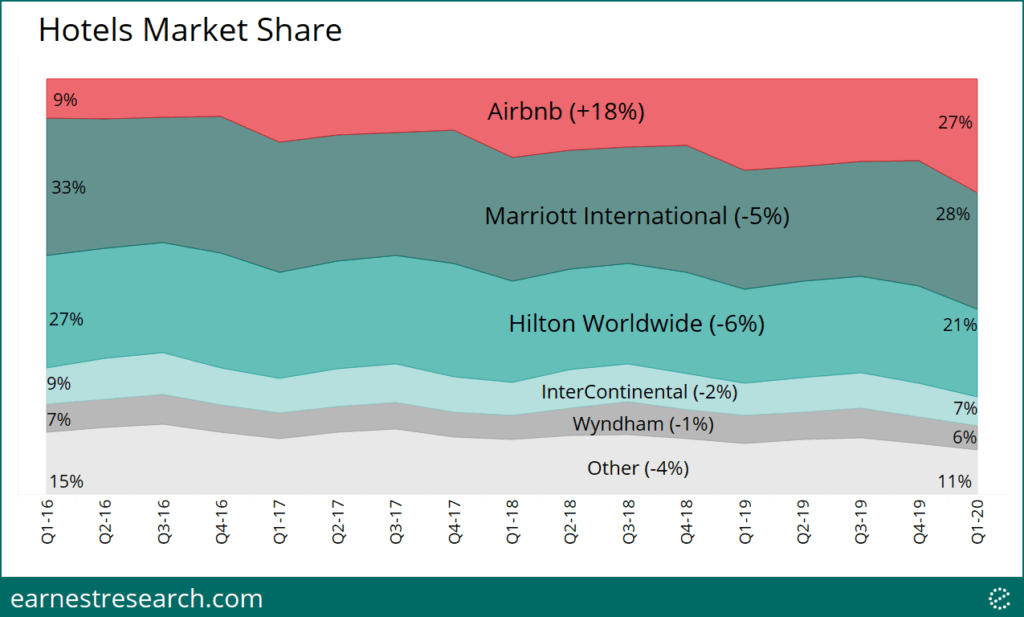
Other hotels consist of Best Western, Choice, Hyatt, and La Quinta.
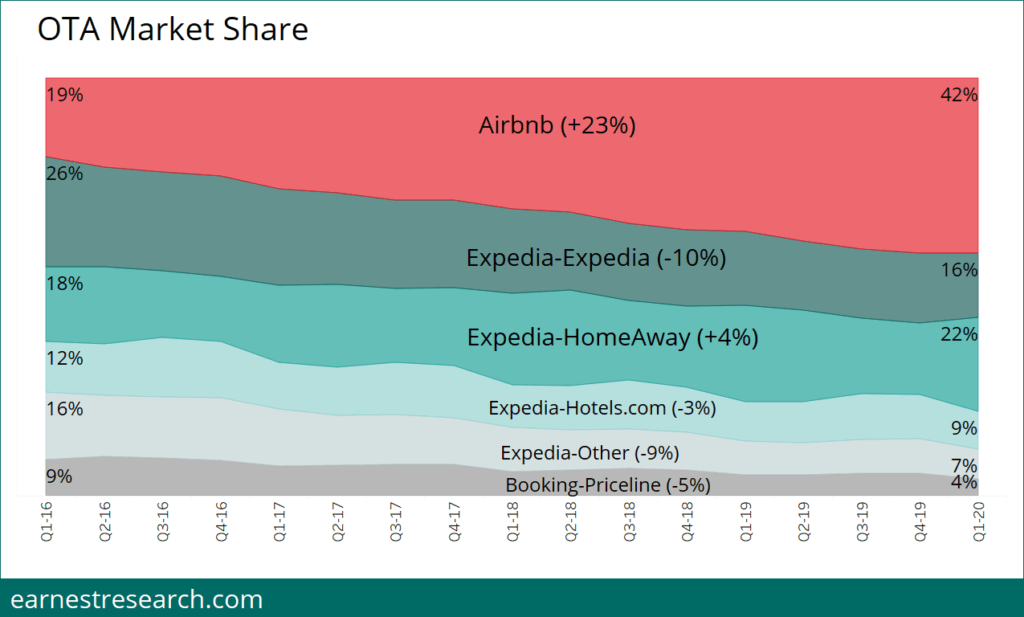
Expedia’s other platforms include Travelocity, Hotwire.com, and Orbitz.
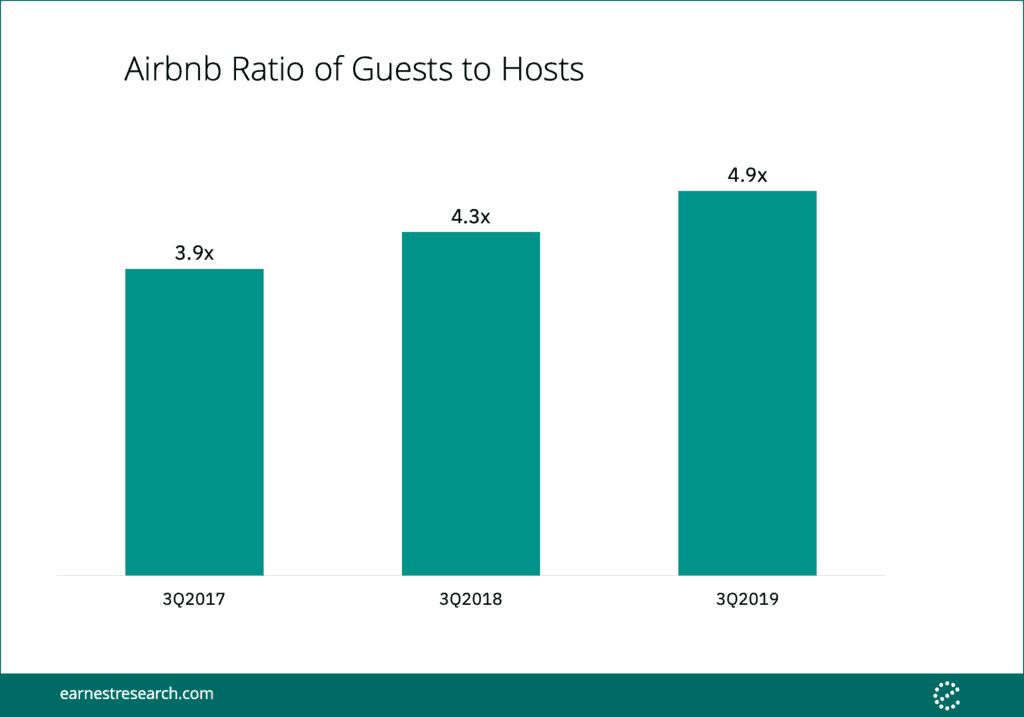
As another marketplace in the gig economy, we wanted to understand both sides of the lodging equation: hosts and guests. We looked at the last three seasonally high volume quarters (3Q), and found the guest-to-host ratio to be ~ 5:1 in 3Q19, up from 4.3:1 in 3Q18, and up from 3.9:1 in 3Q17, implying that guests are growing faster than hosts.
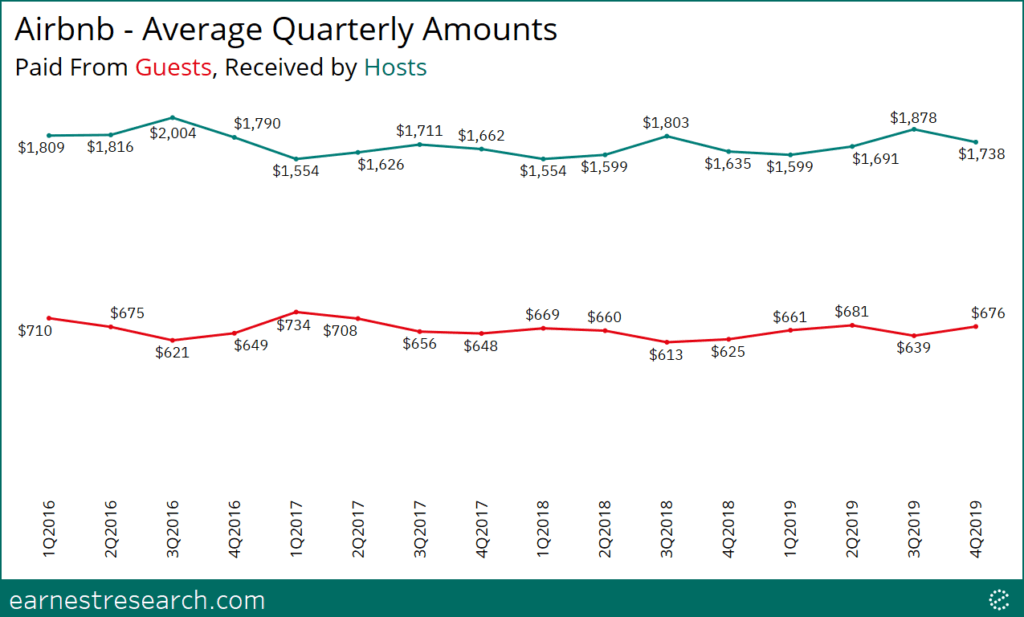
Finally, we looked at the average earnings per host in relation to the average spend per guest. Over the last three years, hosts on average received ~$1500/quarter while guests on average spent ~$650/quarter. The summer season naturally sees higher travel, and therefore saw hosts cash in ~$1650/quarter, while the average spend per guest moved slightly lower to a bit over $600/quarter.
DoorDash and Postmates
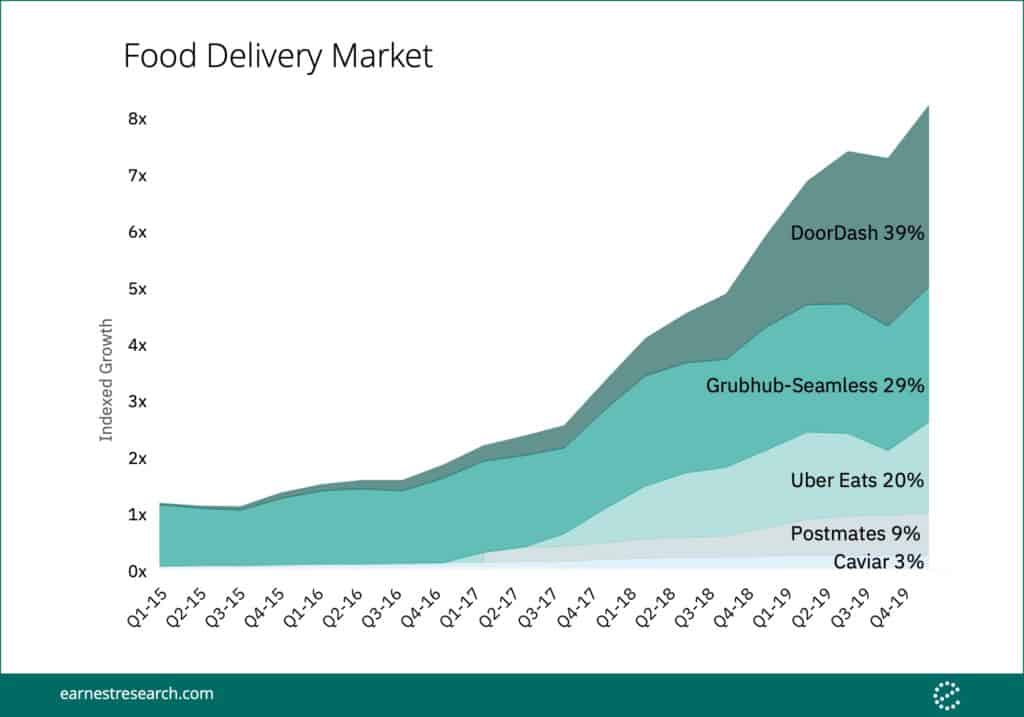
Operating in the increasingly competitive food delivery market, DoorDash and Postmates have each grown considerably. The market as a whole has grown ~7x since 2015, with current leader DoorDash now commanding 39%, ahead of Grubhub-Seamless’ 29%, and Uber Eats’ 20% share. Notably, DoorDash surpassed incumbent Grubhub-Seamless in the middle of 2019, and Postmates hasn’t grown much faster than the market, maintaining roughly 10% share since early 2017.
As these platforms got bigger, the market has seen indiscriminate behavior primarily at Grubhub’s expense. Looking from the perspective of Grubhub’s shoppers, in the most recent three months, 30% of them have also transacted at DoorDash, 17% at Uber Eats, and 10% at Postmates, all up from the roughly 5% overlap figures Grubhub was seeing in 2017.
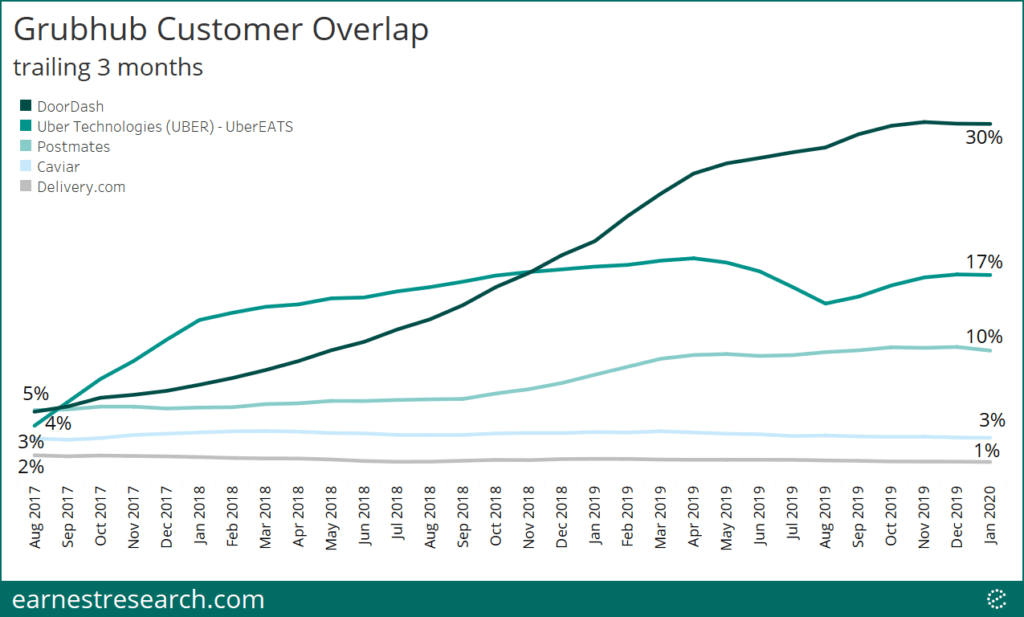
*Uber Eats overlap is likely understated due to structural limitations in the data from May to August 2019.
Instacart
Alongside the on-demand food delivery market, Instacart’s same-day grocery delivery platform has seen growth of over ~ 25x since 2015. Our data indicates that recent concerns of its churned partnership with Amazon’s Whole Foods appears overstated. After a slight dip in May-June 2019, sales subsequently rebounded to continued growth levels for the platform.
Interestingly, the online-grocery market is very much a tale of geographies. For example, while Chicagoans spend half of their online-grocery dollars at Instacart, New Yorkers spend over half of theirs at Fresh Direct, and just ~20% at Instacart. Additionally, the growth of Walmart Online Grocery has been apparent in Chicago, now with ~35% share, but remains negligible in New York with ~3% share. Amazon Fresh is gradually finding its way into both markets with ~10% share in each.
Cole Haan
Adding to the 2020 retail listings is shoemaker Cole Haan, which recently filed its S-1 in mid-February. One of its primary areas of focus is its North American DTC channel, a metric Earnest data can monitor in real-time.
We cut the data by channel to assess performance and found ~ 20% to 50% YoY growth in its digital channel throughout the holiday season and into the new year, while its in-store channel has and continues to see muted growth and YoY declines. This has resulted in its online channel now accounting for just under 50% of its DTC business, up from 38% in 2017.
Topgolf
How do you spend your leisure time? Topgolf, the specialty golf entertainment company, wants to take some of it. We looked at the average annual household spend across a subset of leisure names in four categories: tickets, movie theaters, theme parks, and specialty names.
According to our data, the average household spent ~$125 at Topgolf in 2019, which is above the ~$80 to $100 spent at movie theaters, and slightly ahead of its specialty peers: Dave & Buster’s ~$115 and Main Event’s ~$100. However, specialty golf still trails the ~$200 theme park spend, and hardly competes with the ~$400 household budgets of Ticketmaster and Stubhub.
Casper
We first wrote about the Casper IPO in early February. February is still not looking too cozy for the now public mattress disruptor but still better than its October and November YoY declines.
Notes
Earnest data is derived from the credit, debit, and bill pay records of millions of de-identified U.S. consumers.


