Earnings by Earnest: 4Q 2020
Powered by Earnest Data Products
We’ve highlighted some recent examples of how Earnest data products tracked business health per management’s commentary for Target (TGT), Planet Fitness (PLNT), Lyft (LYFT), and Tractor Supply (TSCO).

Target
“Investors often want to know how much of Target’s growth is being driven by specific strategies or specific assets…Guests who try Drive Up for the first time spend about 30% more on average compared with before, including an increase in conventional store shopping. And we see a similar change in behavior among guests who try Shipt for the first time.”
Michael J. Fiddelke, CFO
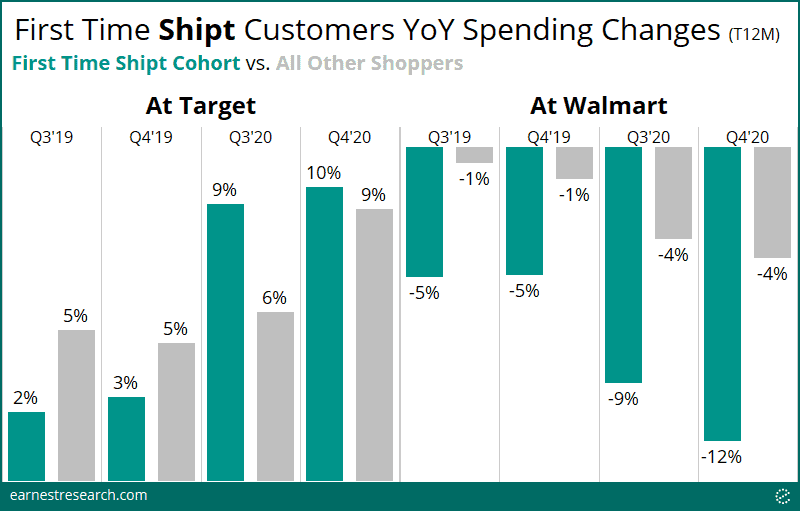
What happens to spending when customers join Shipt for the first time?
During the pandemic-defined year of 2020, new Shipt shoppers’ spending at Target increased 9% YoY in 3Q (trailing 12 months) and 10% in 4Q, which is crucially 1 to 3 points higher than all other Target shoppers. This was not the case in 2019, where first-time* Shipt shoppers spent less than the average Target shopper.
Also of note is that new Shipt shoppers’ spending is much lower at Walmart relative to the average Walmart shopper. First-time Shipt shoppers’ spending at Walmart declined 9% to 12% this past year relative to the 4% declines seen from the average Walmart shopper. Additionally, this delta was worse this past year, relative to 2019.
Planet Fitness
“Yes, the usage, we ended December with about 75% of last year’s workouts, which was up from about — I think it was mid-60s here at the end of Q3. So it did continue to climb in Q4…I know in the past, you’ve talked about how there may be a pop from California reopening, and we’re still seeing closures in California. Should we expect anything around that…when California reopens?. A: Yes. Based on all of the different opening cohorts we saw throughout 2020, we would probably see the same when the billing resumes.”
Christopher J. Rondeau, CEO
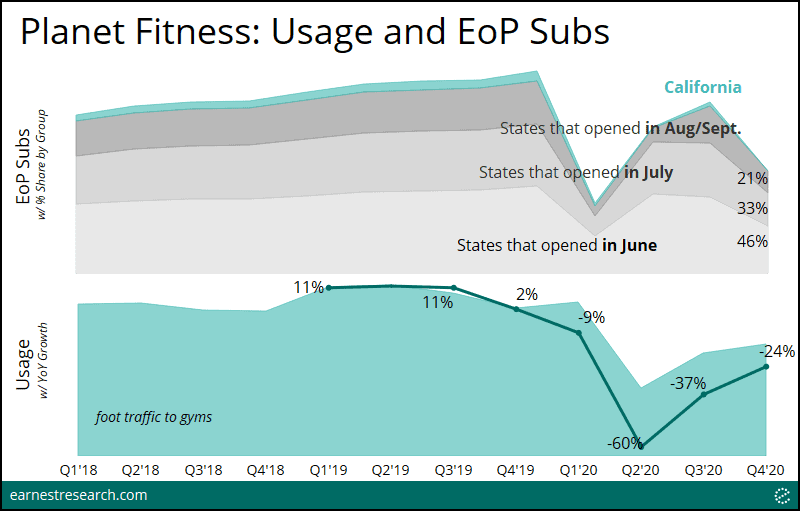
Earnest Foot Traffic shows usage was indeed ~75% of last year’s levels in 4Q (i.e. down 24% YoY), and up from 63% of last year’s level (down 37% YoY) in 3Q. Additionally, as noted, California has been dragging down this overall trend as most gyms in the state remain closed; our spend data thus saw a negligible California share of EOP Subs at year end (note: the company likely continues to recognize California subs as end-of-period subscribers despite gym closures). We expect that when California gyms reopen and begin billing members, a jump in EOP subs will materialize in the first month followed by larger-than-normal pent up churn, mimicking what occurred with some of the earlier re-opened states.
Lyft
“The West Coast generally remains the weakest region, while we’ve seen further rebounding in Florida and Texas as examples.“
Logan D. Green, CEO
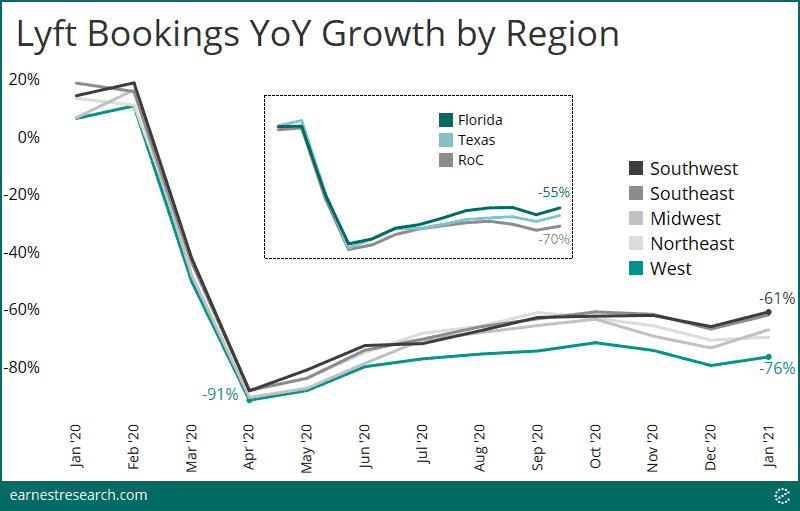
Looking at Lyft bookings growth across regions, the West indeed continues its struggle to rebound from the ~90% YoY declines seen during the pandemic bottom. As of January ‘21, bookings declined 76% in the West, notably, upwards of fifteen points weaker than the rest of the country. We have seen Florida and Texas inch above the other states, with declines of 55% to 60% relative to the 70% declines across the rest of the country.
Tractor Supply Company
“So about 20% of our new customers return and shop with us again within 28 days. And we said that’s above historic run rates by several points. So we feel very good about our retention of these customers.”
Harry A. Lawton, CEO
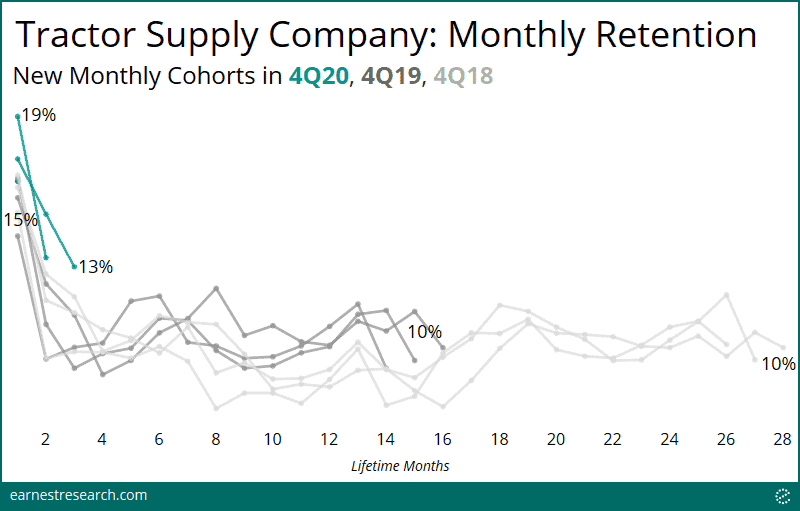
4Q20 monthly cohorts exhibited higher retention rates than previous cohorts, both in the immediate and subsequent months after joining. Within the first month of joining, 17% to 19% of customers returned to shop, roughly 2 points above the 15% to 17% levels seen with prior cohorts. The rates drop ~5 points for all cohorts after a few months, but importantly, retention for the 4Q20 cohort continues to remain ~3 points above prior years, as noted.
Notes
*First-time cohorts determined at the beginning of the period. For example: regarding the 3Q20 YoY spending period, we identify first-time Shipt shoppers in 3Q19, we then aggregate their spending at Target/Walmart in the subsequent 12 months (which is twelve months ending 3Q20), and then compare it to their aggregate spending at Target/Walmart in the prior 12 months to calculate year-over-year growth.


