Earnings by Earnest: 4Q 2019
Earnings by Earnest highlights recent examples of how Earnest tools tracked business health per management’s commentary on earnings results.
For 4Q 2019, we looked at WW, New York Times, Sally Beauty, Tractor Supply Company, and Uber Technologies.

WW International
“Sign up trends have accelerated in 2020, with early January having many of our top sign up dates of all-time in both the U.S. and in our international markets….Q1 is traditionally our annual peak in end-of-period subscribers, sloping to a Q4 trough, with an average 13% decline over the last 5 years. To further illustrate our progress, in 2019, our decline was only 8%, the best seasonal slope in our history.”
-Mindy Grossman and Nicholas Hotchkin, CEO and CFO
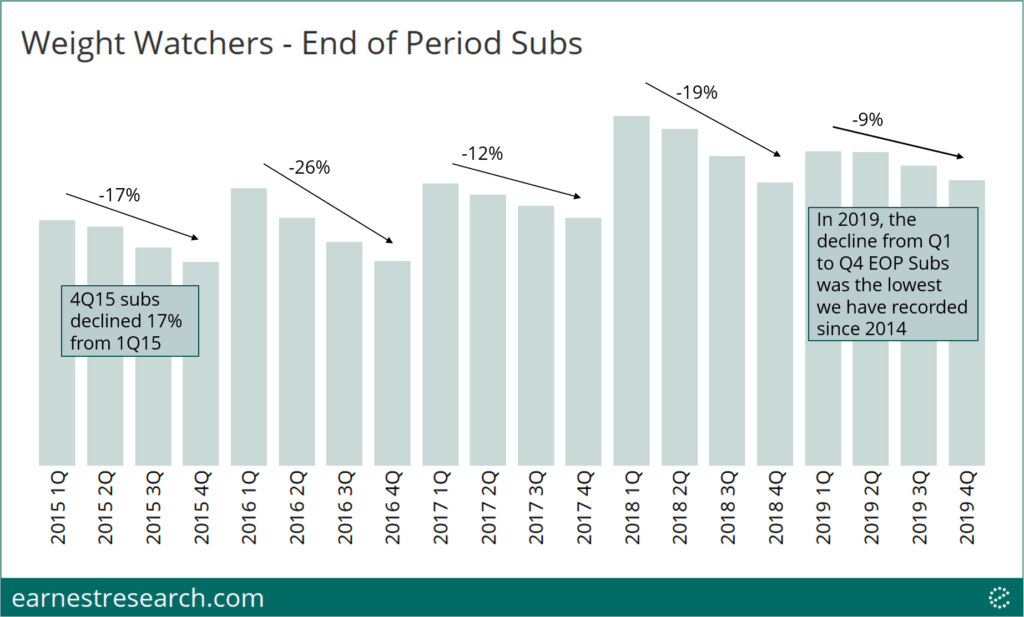
Earnest data shows a 770bp acceleration of subscriber growth into January. Additionally, we looked at the slope of declining subscribers from 1Q to 4Q every year, and found the slope in 2019 to be 9%, the lowest it’s been in five years. The average slope in the data has been 17% since 2015.
The New York Times
“We’re successfully graduating subscribers on even our lowest introductory offers to higher prices and continuing to effectively manage retention as a whole. 17 months after the introduction of the $1-a-week offer in the U.S. and 5 months after the first $1-a-week cohorts hit the 1-year mark, we’re still seeing them retain in line with other cohorts.”
– Mark Thompson, CEO
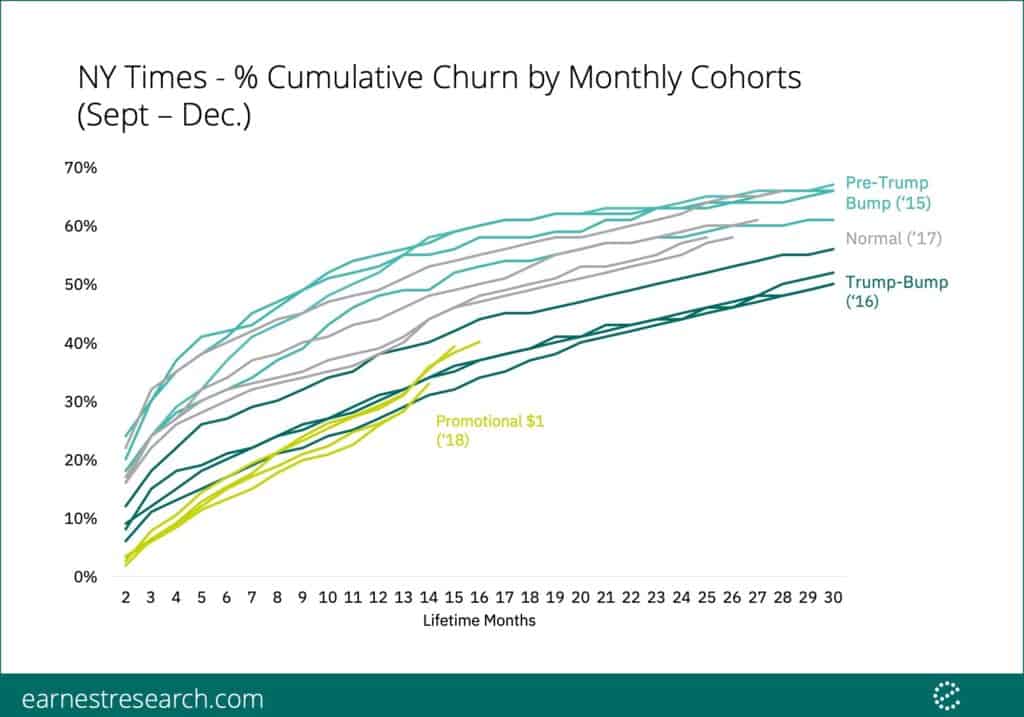
Earnest data shows that the $1 promotional cohorts after the 1-year mark are churning at rates that are below most other selected cohorts, and slightly higher than some of the Trump-bump cohorts.
Sally Beauty Holdings
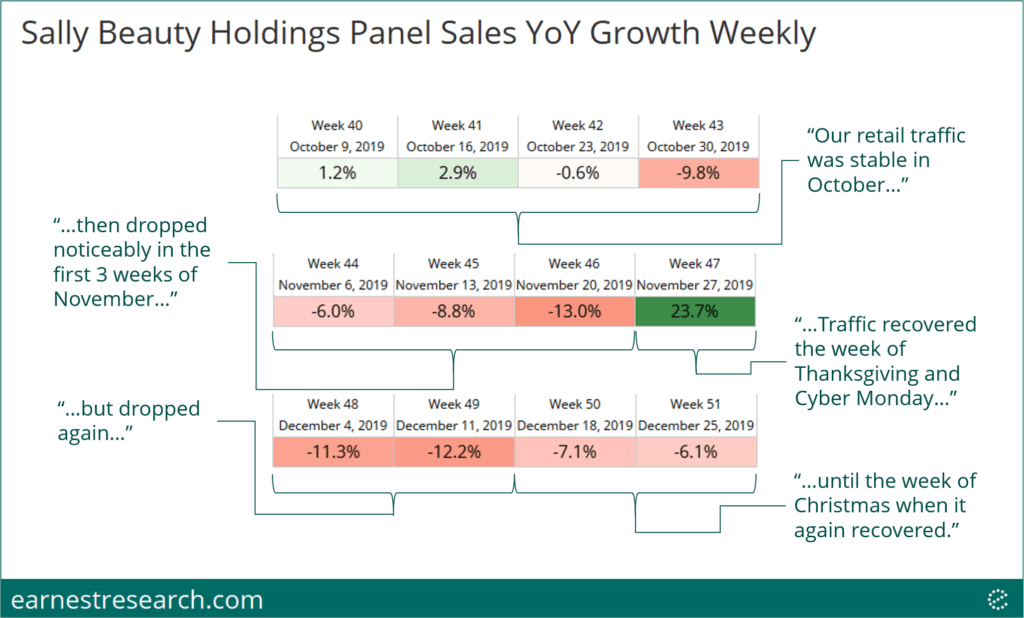
Quotes in chart by Chris Brickman, President & CEO.
We looked at the weekly cadence of performance throughout the quarter in the context of management commentary. October’s low single-digit growth (“stable”) led to high single-digit declines into November (“dropped noticeably”), but then “recovered” the week of Thanksgiving (we note that this is misleading because Black Friday/Cyber Monday sales were shifted this year). It then “dropped again” to double-digit declines, leading into Christmas “when it again recovered;” the data showed a slight improvement but still YoY declines leading up to Christmas.
Tractor Supply Company
Q: Quick follow-up is on the pet category. You mentioned you’re looking at the data and you’re retaining your customers. Are you still acquiring customers at the same rate? I mean retaining is good, but are you still growing your customer base at a rate that you were before?
A: Look, when you look out at Q4 specifically, Q3 and Q4, the ability for us to leverage our Neighbor’s Club capabilities has been really, really strong. So we’re seeing nice gains when it relates to acquiring new customers through utilization of that tool, specifically what Kurt was talking about, a little bit in need with look-alike. So yes, we see us continuing to go out and acquire market share and gain new customers through the category.
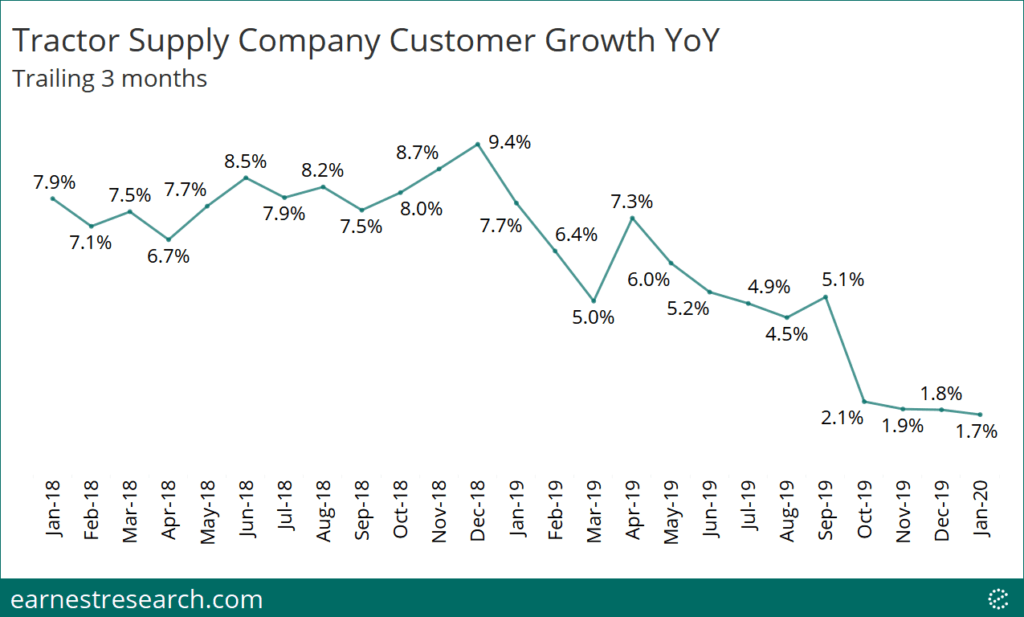
Earnest data shows the number of customers slowing to ~2% YoY growth in the past few months, down from its ~7 to 9% accelerating growth rates it maintained throughout 2018. (Note that our TSCO backtest indicates that this deceleration is likely overstated by ~2 points). We acknowledge that our data on TSCO includes all customers, not just those in the pet-product category that the question addressed. However, for reference, this product category made up 47% of TSCO total sales in 2019 according to company filings.
Uber Technologies
Q: What have you learned since making product changes in California? What’s driver feedback, rider feedback and how has it changed usage and spending?
A: Driver feedback has been positive… I think that the service itself, prices have increased more than they have nationally. So I think from a rider standpoint, the service on balance has gotten more expensive. But it’s very, very early…Short term, it’s been, I’d say, net negative for riders and it’s possibly a net positive for drivers. – Dara Khosrowshahi, CEO
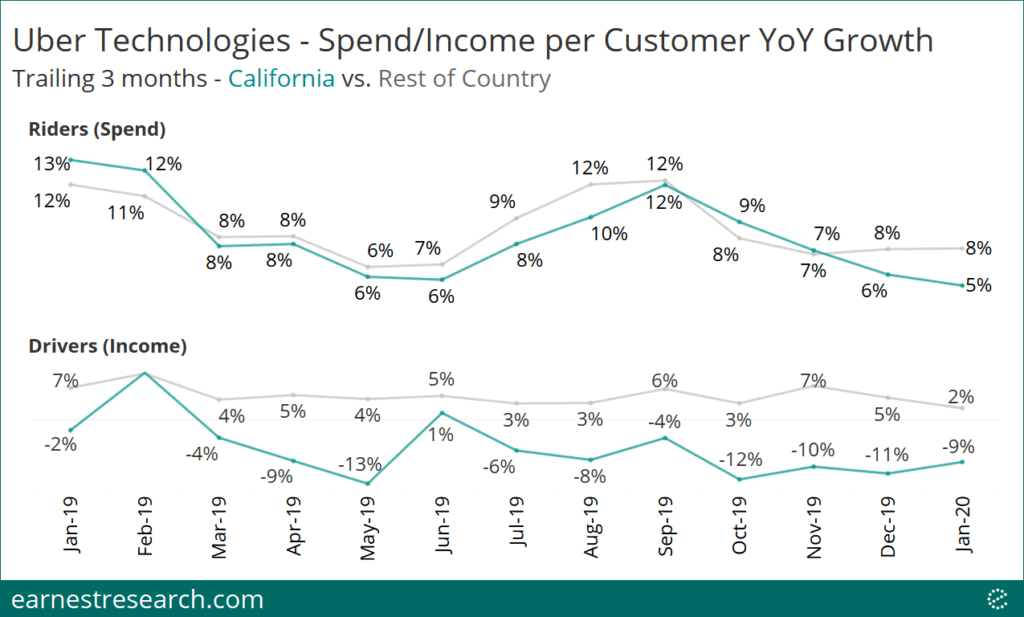
We’ve been monitoring the growth in spend per rider and income per driver in California vs. in the rest of the country since Uber began letting drivers set their own rates in select California cities. To date, riders’ spending growth in California has looked similar to the rest of the country, although it has begun to diverge slightly in the past two months. Income per driver has been declining ~ 5% to 12% in California, relative to mid-single-digit growth in the rest of the country.
For more details about this analysis or Earnest data products, please schedule a demo or reach out to [email protected]


