Casper’s S-1 & Investor Insomnia
In anticipation of Casper’s IPO, we reviewed statements made in the company’s S-1 against the credit, debit, and ACH records of millions of de-identified U.S. consumers.
Casper offers a range of products and services across the entire ‘sleep arc’, reaching customers through its e-commerce platform, 60 retail stores, and 18 retail partnerships. The analysis below captures data in its e-commerce and retail store channels.
Key Takeaways
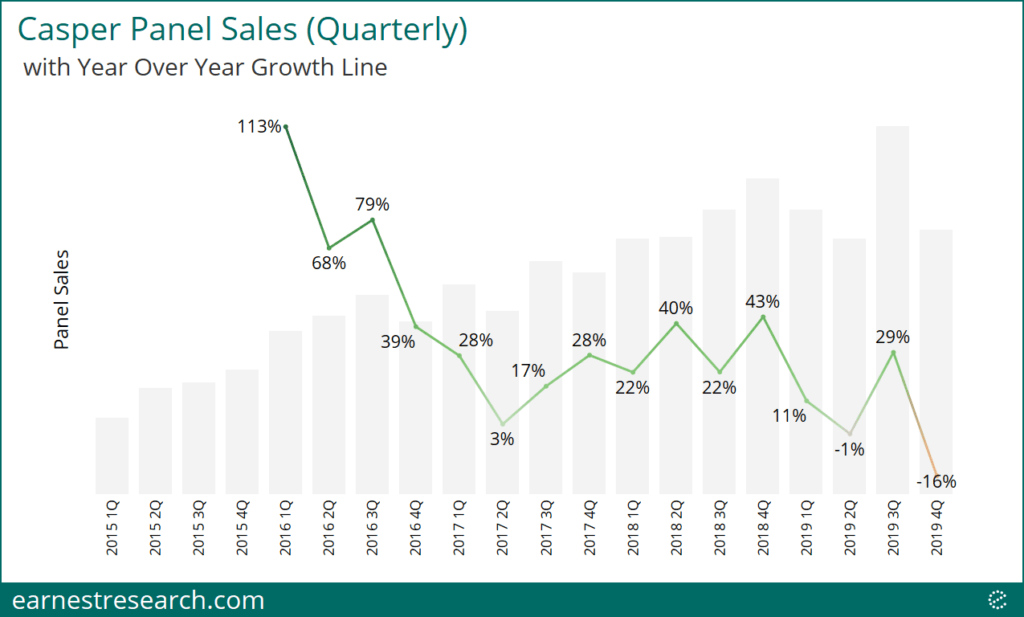
- After experiencing high growth over the past few years, Casper panel sales growth has recently slowed to a YoY decline beginning in October 2019.
- Casper has managed to grab 12% of the DTC mattress market in 2019, up from 8% in 2017, surpassing its close competitor Purple and taking slivers away from dominant-player Mattress Firm.
- Customers tend to return to Casper ~15% of the time within the first year of initial purchase, but they predominantly return in the immediate quarter subsequent to their initial purchase with negligible retention rates afterward.
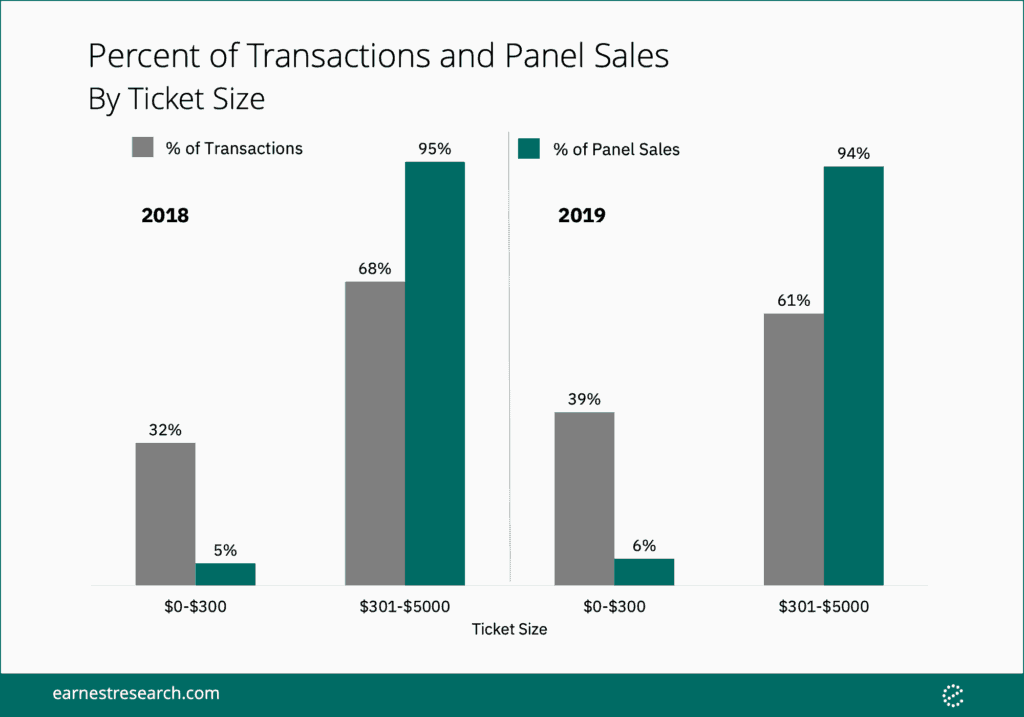
- Sales of Casper’s lower ticket items ($0 – $300) have grown significantly in 2019 and accounted for 39% of total transaction volume (up from 32% in 2018), but continue to contribute just 6% of total panel sales.
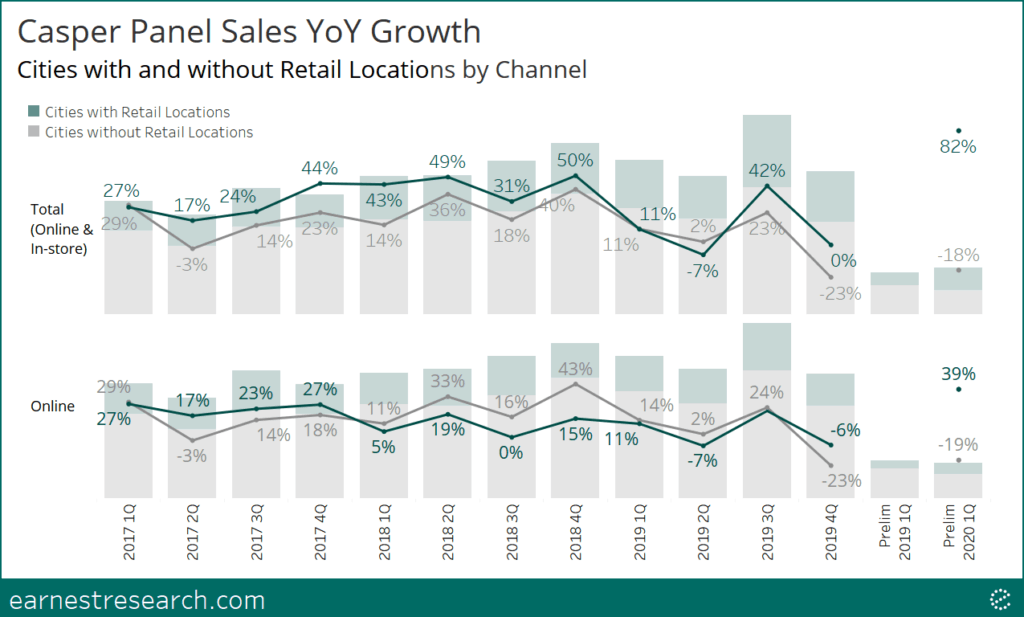
- Panel sales growth in cities with retail locations has generally outperformed those without retail locations by as much as ~30%.
Growth Profile
“In our first five years, Casper has experienced rapid growth. We believe our consumer focus, innovative products, and multichannel go-to-market strategy differentiate us both from legacy competitors and new entrants.”
Earnest data exhibits high YoY growth in Casper panel sales through mid 2019 but has materially slowed to a YoY decline beginning October 2019.
The DTC Sleep Market
“We have many competitors across what we define as the Sleep Economy, including in the mattress, soft goods, and bedroom furniture industries, as well as in non-traditional sleep categories, such as sleep technology, sleep services, and sleep supplements.”
While Mattress Firm continues to be the dominant player in the DTC Sleep market, mostly selling through retail locations, Casper has grabbed 4% of share over the past three years, now commanding 12% of the market. Additionally, Casper surpassed its close competitor Purple in 2018.

Customer Retention
“Importantly, 14% of our customers returned within a year of their original purchase (excluding those customers whose original purchase date was less than one year prior to September 30, 2019 and had not made a repeat purchase as of that date).”
Earnest data exhibits ~15% customer retention within the first year of initial purchase, similar to the numbers reported by the company. Interestingly, retention appears to predominantly occur within the first quarter of a customer’s life. In the past two years, newly acquired customers tend to return to the mattress retailer ~7% to 12% of the time in the immediate quarter subsequent to their initial purchase; a retention rate that quickly falls to 2% or lower throughout the rest of their life.

Lower Ticket Products
“Since the release of our first product, the award-winning Casper mattress, we have expanded into pillows, sheets, duvets, bedroom furniture, sleep accessories, sleep technology, and sleep services.”
Casper’s products include mattresses and bed-frames priced at ~$500 – $3000, and more recently added lower-priced products including pillows, lighting, and bedding at ~$50 – $300. We grouped transactions into two ticket-bin distributions: 1) $0 – $300 and 2) $300+, in order to approximate the success of Casper’s lower-priced products. While the volume of lower-priced products materially outperformed the higher-priced ones, accounting for 39% of total volume in 2019 up from 32% in 2018, its contribution to total sales still appears to be too small to materially impact performance, at just ~5% of total sales.
Online & In-Store AOV
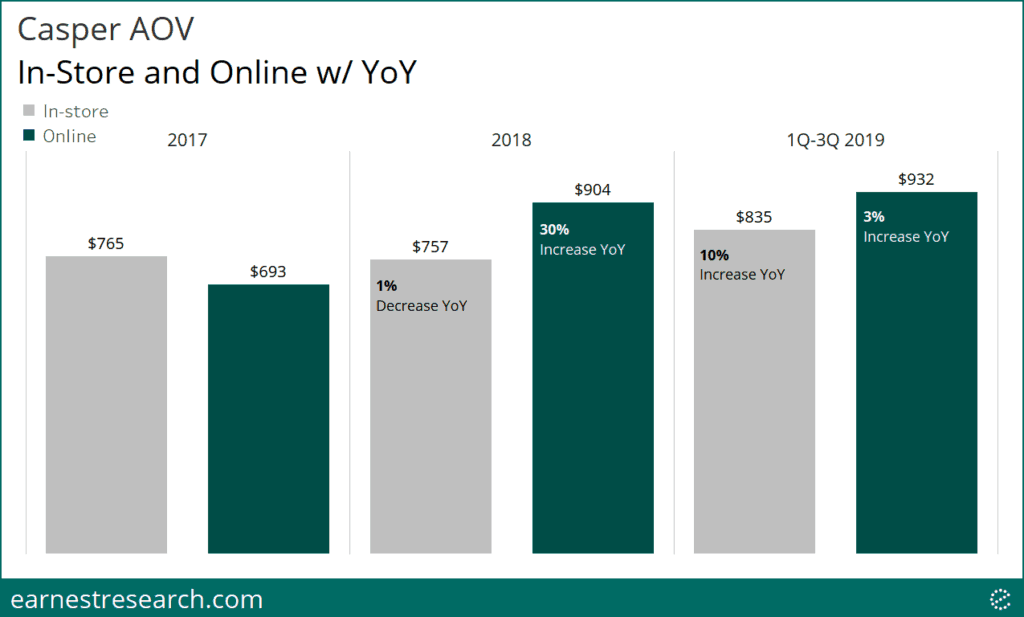
“Across our e-commerce channel, our average order value, or AOV, which is defined as net revenue divided by total orders placed, increased from $583 in 2017 to $686 in 2018 (18% YoY) and to $710 for the nine months ended September 30, 2019 (3% YoY)…Across our retail channel, our AOV increased from $437 in 2017 to $720 in 2018 (65% YoY) and to $820 for the nine months ended September 30, 2019 (14% YoY).”
Earnest data tracked a directionally similar YoY growth in AOV among both the online* and in-store channels. For online purchases, Earnest data exhibited 30% YoY and 3% YoY (vs. company reported 18% YoY and 3% YoY) for 2018 and the first nine months of 2019, respectively. For in-store purchases, Earnest data exhibited -1% YoY** and 10% YoY (vs. company reported 65% YoY and 14% YoY) for 2018 and the first nine months of 2019, respectively.
Cities with Retail Stores Outperform
“We believe our multi-channel expansion creates synergies and that these channels, to date, have proven to be complementary, not cannibalistic. In fact, for the nine months ended September 30, 2019, our direct-to-consumer sales in cities where we have opened retail stores have grown over 100% faster on average than cities without a Casper retail store.”
Earnest data has tracked stronger YoY growth in cities with a retail location*** than in cities without a retail presence over the past three years. However, before the current preliminary 1Q 2020, this outperformance has never exceeded ~30%. In the current preliminary period (27 days of data), outperformance has reached its highest at ~100% in both online and in-store channels, and ~60% in just the online channel.
Notes
Earnest data is unable to identify Casper transactions through its wholesale channel.
In most cases, Earnest data is unable to capture mattress purchases that are financed by third parties, including Affirm, which offers consumer financing options for Casper. Note that most mattress retailers are sensitive to this exclusion.
*We recognize that our nominal AOV values in the online channel are materially higher than company figures.
**2017 saw a very small sample of in-store transactions, likely skewing results from company figures.
***Cities with retail locations are defined as those cities that have retail locations as of January 2020 and are grouped as such for the entirety of the time series. Earnest data does not include international sales, thus missing Casper’s seven locations in Canada.


